When most people think of the ocean, they think mostly of water, not the land that lies underneath it. But bathymetry, which is the study of water depth, is critical for understanding our coastlines. Water depth influences currents, waves, and where different marine life can live. Like topography on land, drone mapping can help collect bathymetric data when the water is shallow and clear enough.
There are two methods researchers use to extract bathymetry data from drone images: the photogrammetry method and the spectral method. ACTYS is a collaborative project between two FORTH Institutes, the Institute of Mediterranean Studies and the Institute of Computer Science, that aims to combine these two methods to more accurately map bathymetry. Dr Evangelos Alevizos is a postdoctoral research fellow in the ACTYS research team.
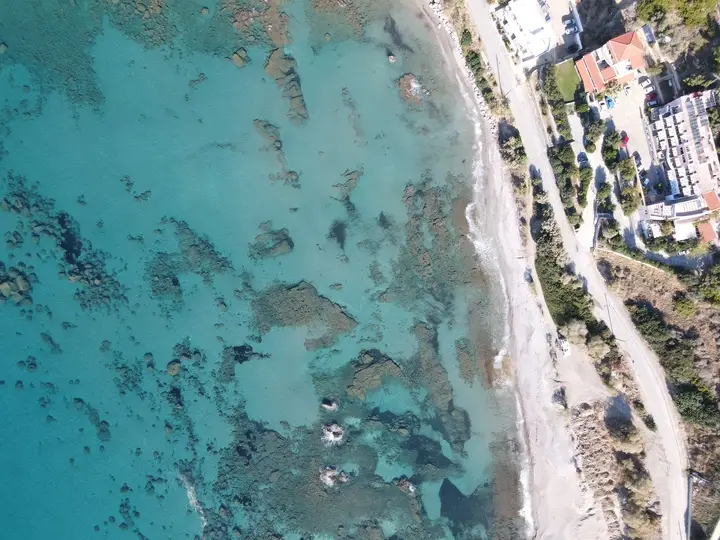
“Here in the Mediterranean, we have very good water transparency, which allows us to have very nice images of sea floor up to 10 metres at least,” Evan said.
“Project ACTYS is about mapping the bathymetry of shallow water areas here in the Mediterranean and using drones and advanced techniques. So we combined two different approaches in our project. We combined photogrammetric approaches and the spectral information together, we’ve fused them in one, let’s say workflow.”
So what are the photogrammetric and spectral methods?
Photogrammetric method
When a drone flies a mapping mission, photogrammetry is the process that stiches all the images together into an orthomosaic. The overlap between images required for photogrammetry to work means that features have their images taken from multiple angles. Photogrammetry software can then use these different angles to produce a three-dimensional model.
However, because photogrammetry relies on identifying shared features between images, it struggles when the seafloor lacks texture or features.
“The algorithms that do this are failing when there are no correspondence, enough correspondences between two images. So imagine that you are having imagery over a very nice, smooth, sandy area. This would be a big problem for the photogrammetric approach,” Evan said.
“Another issue with photogrammetry is that you need to account for the water refraction because you have the interface between the water and air. Within ACTYS, we developed algorithms which take refraction into account.”
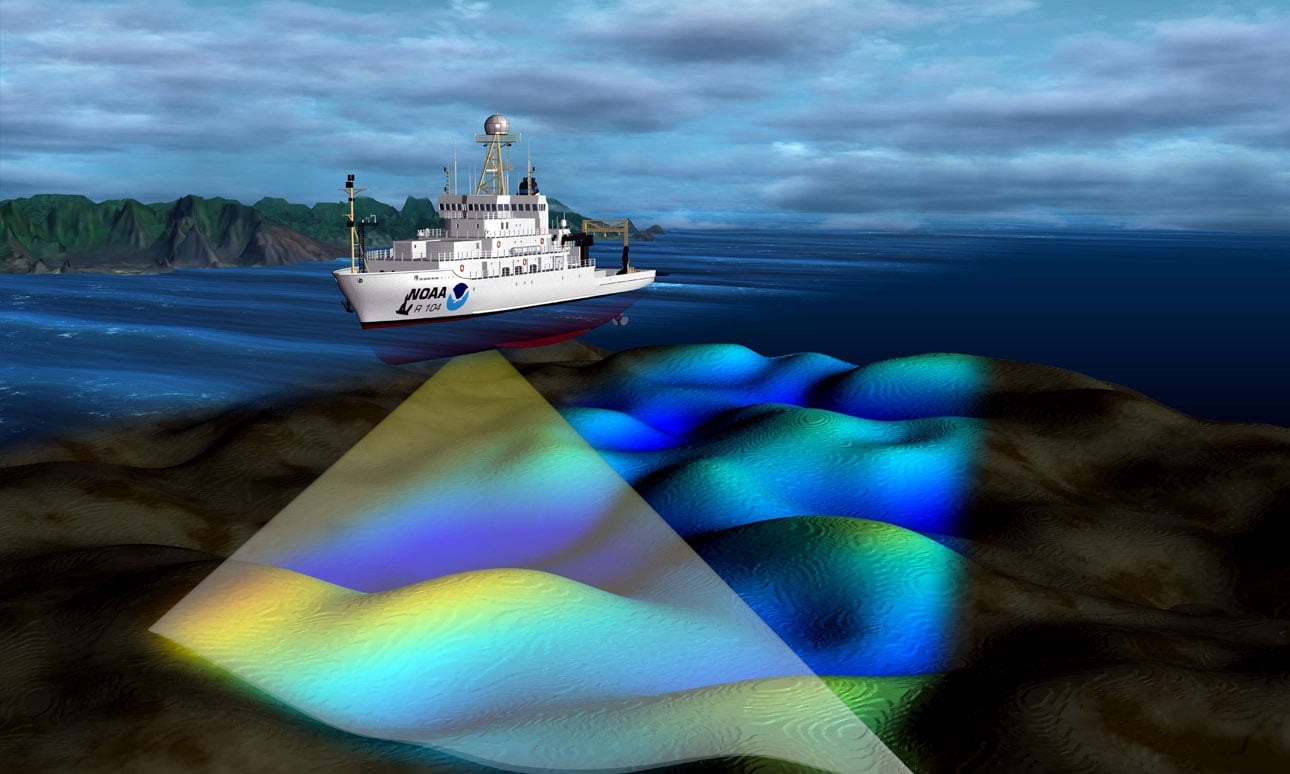
Why doesn’t sonar work in the shallows?
Project ACTYS is about mapping bathymetry in shallow water. It’s important because multibeam, which researchers use to map the deeper ocean, isn’t very effective in shallow water. Multibeam is a form of sonar that can map large swathes of bathymetry from a boat. It works by releasing pings of sound at specific frequencies. The time between these pings and when they echo back from the seafloor tells researchers how deep the water is. However, the closer the seafloor is to the multibeam, the less seafloor area it can map in one pass. So in really shallow areas, using multibeam becomes very inefficient.
Spectral method
Have you ever noticed the way the ocean changes colour with depth? These colour changes occur because different water depths reflect different intensities in the red, green and blue bands of the visible light spectrum. RGB or multispectral sensors on drones can quantitatively record this difference.
“When you get the reflectances either from the RGB or the multispectral sensor, then you can apply, for example, band ratio like the blue over the red band or the green over the red band and then extract bathymetric information,” Evan said.
“But in order to do that, you need to have ground truth data points from actual measurements of the depth, because this is an empirical method.”

The ACTYS team use a small uncrewed surface vehicle (USV) with sonar to collect these ground truth data points. Using this data, they can relate certain band ratios with depth.
“You take advantage of the different responses between the two bands in your band ratio and you tune a linear equation, a linear formula or even a more complex machine learning algorithm”, he said. “You tune it, using the insitu measurements that you need to have.”
Unlike photogrammetry, this method works well even when the seafloor doesn’t have many features. But while photogrammetry can be applied anywhere, the spectral method needs in-situ data to work. This limits it’s use to locations where this data has been collected.
“So it’s a model that we apply that’s not universal, but it’s rather local, and it works for this particular data that were taken at this particular area. So we combine the bathymetry, let’s say of today, from the USV platform with imagery from that area and the result that we get so the tuning of the band ratio applies for this particular data set at this particular area,” Evan said.
“If we would like to apply this in another area, with different water constituents, different water absorption and possibly different seafloor types, then the results would definitely be influenced,” he said.
Project ACTYS
By combing both the spectral and photogrammetric methods, together with deep learning models, the ACTYS team aims to produce higher quality shallow bathymetry data with drones.
“We take advantage of a sparse 3D reconstruction from photogrammetry, and then we use this to calibrate together with sonar data the band ratio approach and to extract the final bathymetry and we get very good results, very good accuracy around 30 to 40 centimetres,” Evan said.
“We are quite optimistic that this approach is robust and it can be applied on drone imagery, either RGB or multispectral as long as there is good visibility in the water column,” he added.
The data this combined method can collect will be important for a lot of coastal management and planning.
“This shallow bathymetry information, it helps us better to understand the different coastline structures and how this might respond to different erosion patterns, for example, or shallow bathymetry helps us understand the distribution of rocky reefs in an area,” Evan said.
“In addition, we can also map for example, submerged cultural sites, in effect, archaeological remains that are not obvious with more compatible methods. And also, we are hoping that our method is going to help with coastal planning in general.”
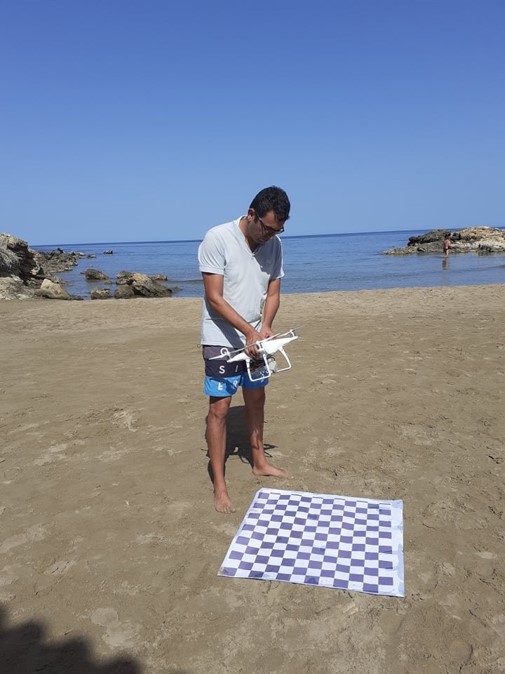
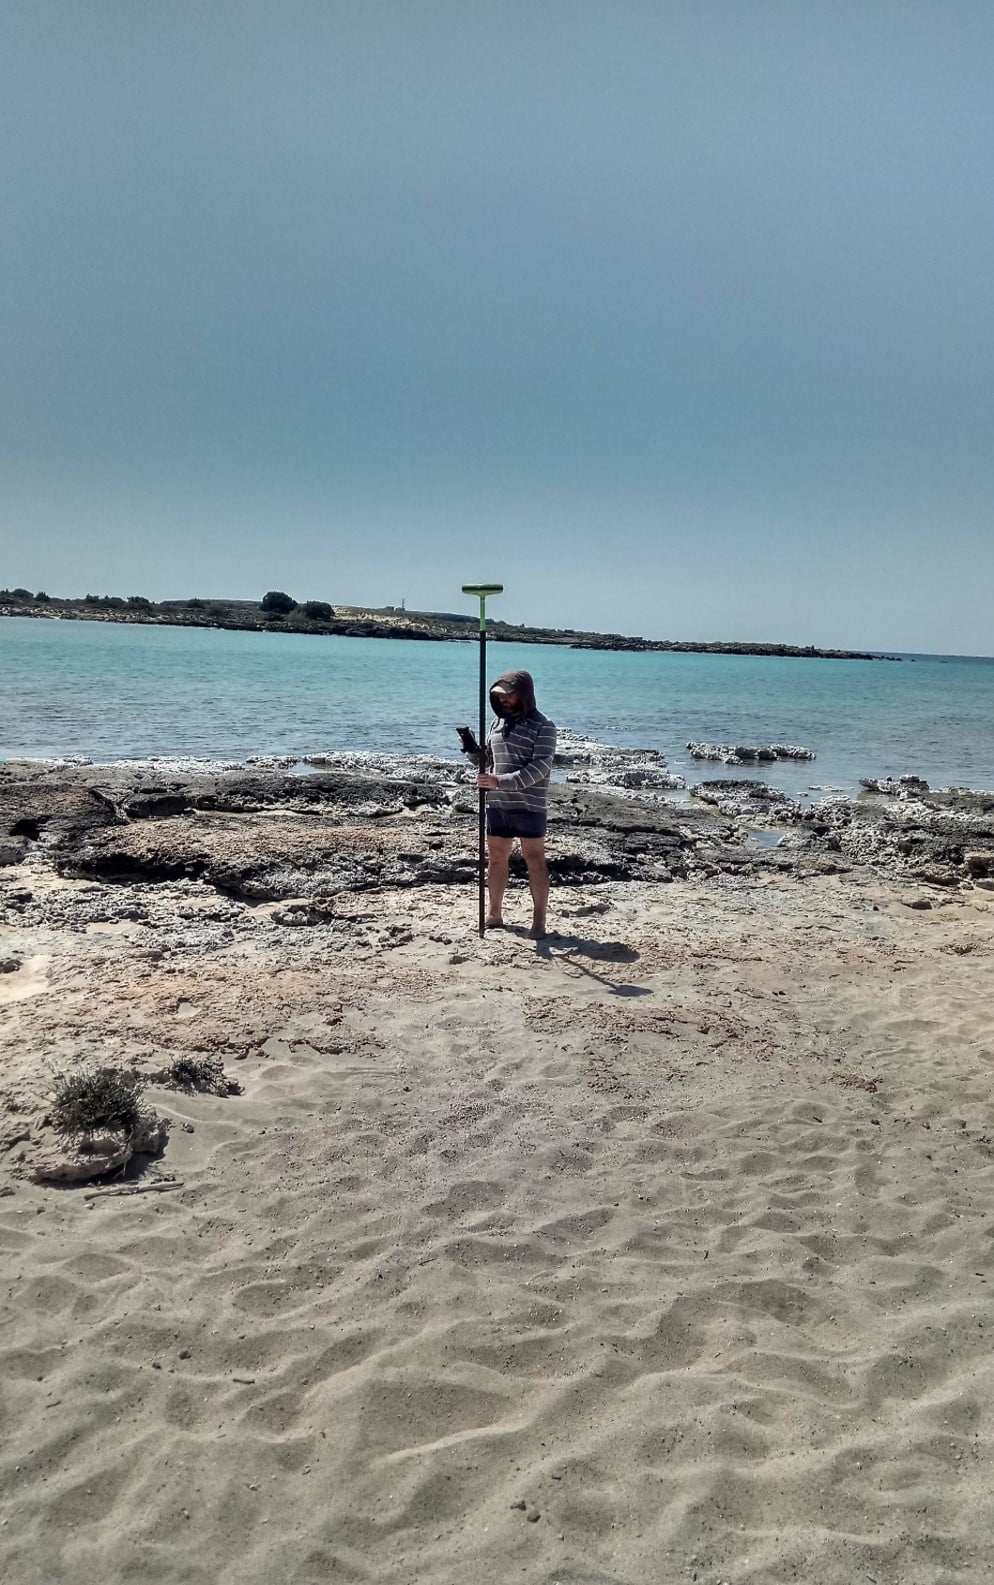
The ACTYS team conducting fieldwork to collect data.
Source: Evangelos Alevizos
Explore more on GeoNadir
GeoNadir is a platform for the storing, managing and sharing of drone data. You can get started for free! Just upload your data for secure storage, automatically generated orthomosaics, and easy sharing. You’ll also be contributing to making drone data more widely accessible for everyone!