Types of environmental sensors for drones

Drones are an extremely useful tool for capturing large quantities of high-quality environmental data. But you might not realise just how much data you can capture with them, especially when you start adding sensors. So here’s a rundown of the most common types of environmental sensors you can use with a drone, and the data they capture.

RGB sensors

The standard type of environmental sensor most drones are equipped with is an RGB sensor. RGB simply stands for Red Green Blue and is a fancy term for your average camera. They capture the same wavelengths of light as the human eye, so pictures they take match what we see.


VisibleLightSpectrum
Visible light spectrum by davidsancar

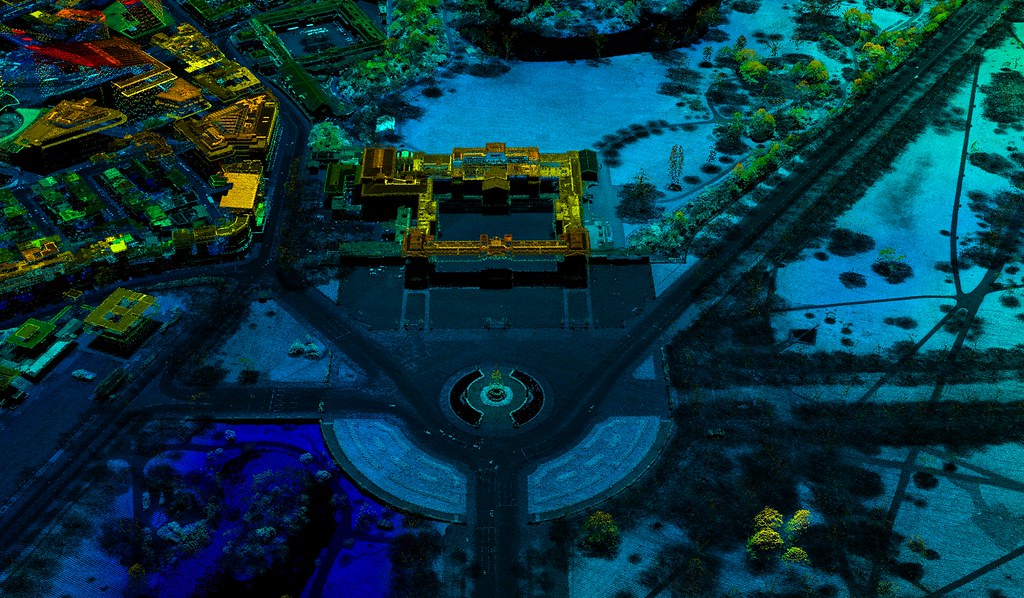
One of the most effective ways to capture data using an RGB sensor is to fly mapping missions. On a mapping mission, a drone flies in a specific pattern, taking pictures at regular intervals. These pictures have a lot of overlap and sidelap. Photogrammetry software then processes these images to produce useful data outputs, like orthomosaics, point clouds, and digital elevation models. You can read more about photogrammetry and its applications here


Most drones come with an RGB sensor, but some sensors have better spatial resolution than others. The spatial resolution of an RGB sensor (or any sensor) is important. Spatial resolution determines what altitude you can fly a drone, without losing important details in the images. A drone with a lower spatial resolution camera will have to fly closer to the ground to capture the same detail as a high spatial resolution sensor flying at a higher altitude. You can read more about the importance of spatial resolution when drone mapping here.

The electromagnetic spectrum

Most types of environmental sensors for drones work by detecting different wavelengths of electromagnetic radiation. To understand these sensors, it’s useful to have a grasp of the basics of the electromagnetic spectrum. Don’t worry, it’s a lot less scary than it sounds. In fact you’re probably pretty familiar with most wavelengths of the electromagnetic spectrum already.


One group of wavelengths that we’re very familiar with is visible light. This is the part of the electromagnetic spectrum that we can see with the human eye. It falls between the wavelengths of 400 and 700 microns. When you have wavelengths longer than the visible spectrum, you move into infrared, followed by microwaves and radio waves. Go shorter than visible light, and you get ultraviolet (the stuff that gives you sunburn) and x-rays.


Spectroscopy is the study of what electromagnetic wavelengths an object absorbs, emits, transmits, and reflects. Different objects have different spectral signatures based on their properties and composition. If we know the spectral signature of an object, we can detect it from remotely sensed electromagnetic radiation, rather than just relying on visible light. 

Electromagnetic spectrum by Victor Blactus

Multispectral sensors

RGB cameras only measure the red, green, and blue wavebands. The images they produce are intuitive to us since these are the same wavebands that our eyes detect. But the reflection of other wavelengths of the electromagnetic spectrum can also tell us useful information. Multispectral sensors can detect up to 15 different wavebands. Some will even detect wavebands beyond the visible spectrum and into the near-infrared spectrum. Two objects that might be indistinguishable in an RGB image, may be easy to differentiate in a multispectral image. Multispectral sensing can also provide information about the properties of an object.


It’s for this reason that they’ve seen a lot of use in precision agriculture. Healthy plants reflect more near-infrared (NIR) than unhealthy plants. When paired with drones, NIR multispectral sensors offer a way to quickly assess the health of large areas of crops. Different multispectral sensors will be better at detecting different wavebands, and the sensor you use should depend on what spectral signature you need to identify most accurately.

Hyperspectral sensors

Hyperspectral sensors are similar to multispectral sensors. But whereas multispectral sensors might measure up to 15 wavebands, hyperspectral sensors measure over 100 continuous bands. This means these sensors can detect minute differences in spectral signatures. If you have the information to interpret these spectral signatures, hyperspectral sensors can provide valuable insight.

Thermal sensors

Thermal data

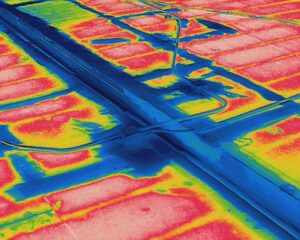
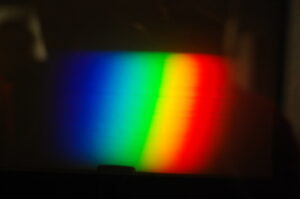
Thermal sensors operate by detecting electromagnetic radiation from the long-wave infrared (LWIR) spectrum. Any object above absolute zero emits infrared. Depending on its temperature an object will emit either NIR, short-wave infrared (SWIR) or LWIR. Hotter objects emit shorter infrared wavelengths. Most terrestrial objects are a temperature that emits LWIR, so to detect heat, you need a LWIR  (or thermal) sensor. 


Fun fact: When an object gets really hot, the infrared wavelengths get so short that they move into the visible spectrum. That’s why really hot object will glow an orange/red colour. The colour of the flame close to the source of a Bunsen burner is blue as it’s even hotter still.


Thermal sensors have seen wide applications in wildlife science since many animals are more much more visible in LWIR than visible light. They’re also extremely useful in the infrastructure space, and have been used to help understand how glaciers are melting.

LiDAR

LiDAR (Light Detection and Ranging) is a fairly old technology and has been used in terrestrial mapping since the 1960’s. It works by emitting pulses of light of a specific wavelength from a laser. The sensor then measures the time it takes for those pulses to be reflected back by a nearby object back. From these reflected pulses, the sensor creates a 3D point cloud of topography, similar to the output from photogrammetry.


Elevation data from photogrammetry is often accurate than LiDAR – depending on the environment. The accompanying photographs from photogrammetry can also provide valuable contextual information often lacking from a LiDAR point cloud. LiDAR also requires highly accurate, real-time positioning data, whereas photogrammetry can use ground control points and post-processing to georeference objects. One area where LiDAR does provide a key advantage over photogrammetry is in areas with dense vegetation. While photogrammetry might struggle to produce accurate topography under dense vegetation, LiDAR beams can go through gaps in the foliage, allowing the sensor to detect the underlying surface. They also have the advantage of providing data quickly, without need for the considerable post-processing of photogrammetry.

LiDAR example

An example of a LiDAR output. Buckingham Palace LIDAR point cloud by Environment Agency

Adding different types of environmental sensors to your drone

RGB cameras

As we’ve already mentioned, most drones come with an RGB sensor, meaning you generally won’t need to make any modifications to your drone to capture RGB data or conduct drone mapping missions. That being said, buying a drone with a higher resolution camera, or switching an older camera for a newer, higher resolution camera (if it’s compatible with your drone) can improve the quality of the RGB data you collect and improve the efficiency of your mapping missions.


Multispectral sensor

When it comes to multispectral sensors, some drones, like DJI’s P4 Multispectral, come with an integrated multispectral imaging system. Alternatively, you can buy an add-on multispectral camera that you can integrate with a drone you already own.


Hyperspectral sensors

Similar to multispectral sensors, you can buy hyperspectral sensors to add onto your existing drone. But this technology is still evolving, so current hyperspectral sensors are often quite heavy and large This means you need a larger drone with a higher payload capacity if you want to use these sensors.


LiDAR

LiDAR sensors can be added to any drone so long as they are capable of handling the increased payload of the sensor. Like hyperspectral sensors, LiDAR sensors can be quite heavy, and are often paired with an RGB camera or multispectral sensor for data collection. You can read more about some of the available LiDAR sensors on the market, and recommended drones to carry them, here.

Considering your drone’s payload

If you’re adding different types of environmental sensors to your drone, you need to consider your drone’s payload capacity. Payload refers to the weight that your drone can safely carry. It’s usually considered as anything additional to the weight of the drone, like extra sensors. Generally, the larger the drone, the larger its payload capacity. For example, the Mavic Pro 2 has a payload capacity of about 900g, whereas the Phantom Pro 4 has a payload capacity of 2.3kg. A LiDAR sensor for a drone might weigh a few kilograms, while a multispectral camera might only weigh a few hundred grams. Another thing to consider as you increase payload, is that the drain on the drone’s battery increases. So an area you might normally be able to cover in one drone flight might require two if you’ve loaded your drone up with sensors.


So if you’re wanting to collect a wide range of data with your drone, especially if it might require a heftier sensor, make sure your drone has the payload capacity for it.

Add your data to GeoNadir

At GeoNadir we are dedicated to building a detailed map of the world using crowd-sourced drone data to help monitor changes in at-risk ecosystems globally.

To do that we need your help! If you have any drone mapping datasets languishing on a hard drive, consider uploading them to our platform. We’ll make sure they’re stored safely and securely, plus they’ll be available for anyone to view so others can learn from your work. Getting started is free! You can check out some of the awesome datasets that people have already uploaded here.

Keen to learn more about drone mapping?

We offer a range of resources to get you started drone mapping. Why not explore our online training or free e-book?

Subscribe for more stories from above, tips, & tricks

Share this article with your peers on social media.

Facebook
Twitter
LinkedIn
Topographic map with dots displaying data points of environmental drone mapping data. Three drone mapping overlays in different environments

Get a free account

  • Unlimited orthomosaics
  • Unlimited uploads
  • Free storage
Manage, process, analyze, and collaborate with your drone mapping data.