What is photogrammetry?

Photogrammetry is the science of taking measurements from photographs. We can make photographic measurements using photos taken at ground level, from aerial platforms, and even underwater. One of the most important elements of photogrammetry is taking lots of photos with high amounts of overlap between adjacent pictures.


Aerial photogrammetry was initially limited to organisations with the means to conduct surveys with fixed-wing, piloted aircraft. These types of surveys mapped landcover (e.g. vegetation, cleared areas), and created topographic maps.  These days, however, this process has become a lot easier and more accessible. Drones make it much easier and cheaper to capture the many images needed for photogrammetry, while advances in computer vision algorithms mean we can now process many thousands of images using a range of off-the-shelf photogrammetry software packages.

What are the main outputs from photogrammetry?

There are lots of useful outputs from photogrammetry, but the main outputs we’ll discuss in detail are:


  • Orthomosaic;
  • Digital elevation model (DEM) – both digital surface model (DSM) and digital terrain model (DTM);
  • 3D model or mesh; and
  • Point cloud.

Orthomosaic

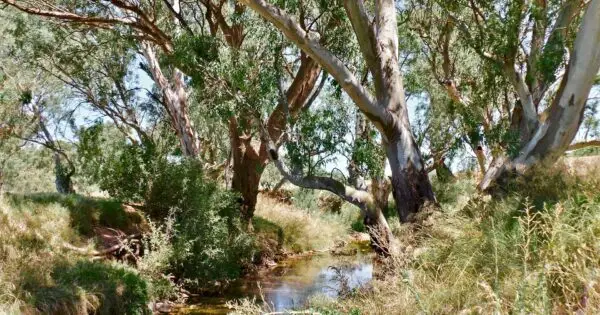
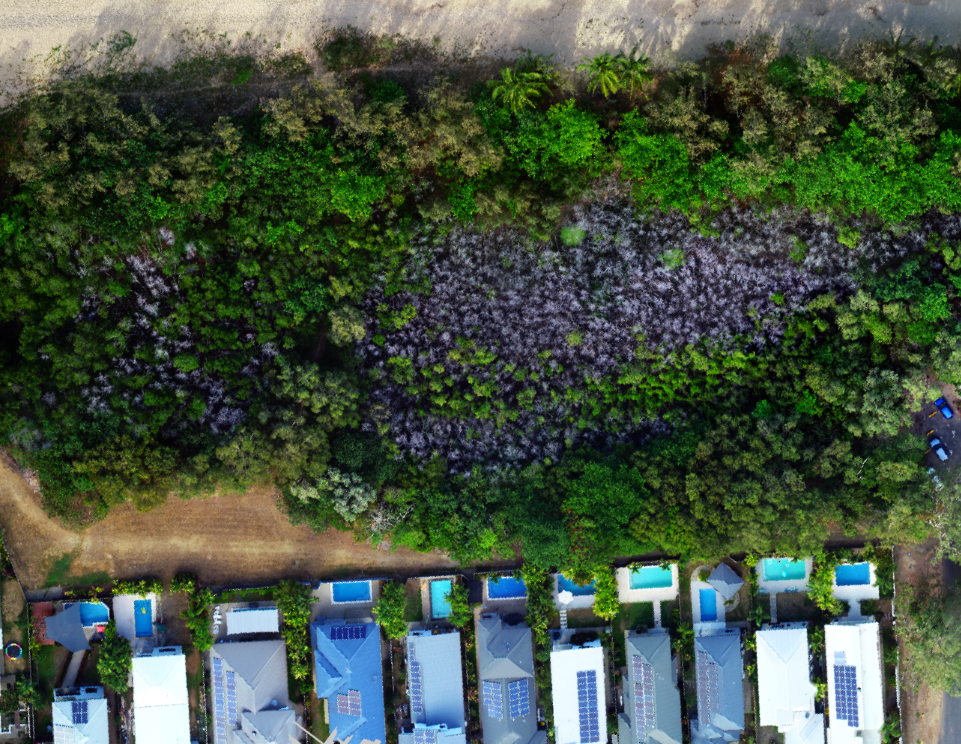
An orthomosaic is a composite of images that have been stitched together by a program to form a single, larger image. Before stitching images together, distortions created in individual aerial photos are corrected. Distortions come from factors including camera tilt, lens distortion, the height of features in the image, and how far away they are from the center of the photo. Correcting these distortions creates an orthophoto – or ‘true’ photo. Consequently, all the features in an orthophoto are uniform in scale and perspective. 


Many orthophotos stitched together makes an orthomosaic. The result is one large image with uniform scale throughout, making it useful in mapping applications. The image below is a component of a larger orthomosaic. Although it looks like a single photo, it is in fact made up of many images combined together.

photogrammetry

Digital elevation model

A digital elevation model – or DEM for short – describes surface terrain features. DEMs are one output possible from drone data collection and processing. Other sensors, like LiDAR and RADAR also produce DEMs.


DEM generally refers to any type of elevation model, including digital terrain models (DTM) and digital surface models (DSM). DTMs measure the terrain without the objects on the land (e.g. trees, buildings etc). On the other hand, DSMs represent the terrain including the objects on the surface.


The two images overlaid below show the DTM and DSM that were created in the process of generating the above orthomosaic. They all cover the same area. If we subtract the DTM from the DSM, we’ll actually be able to estimate the heights of trees and buildings. Pretty cool!

photogrammetry 
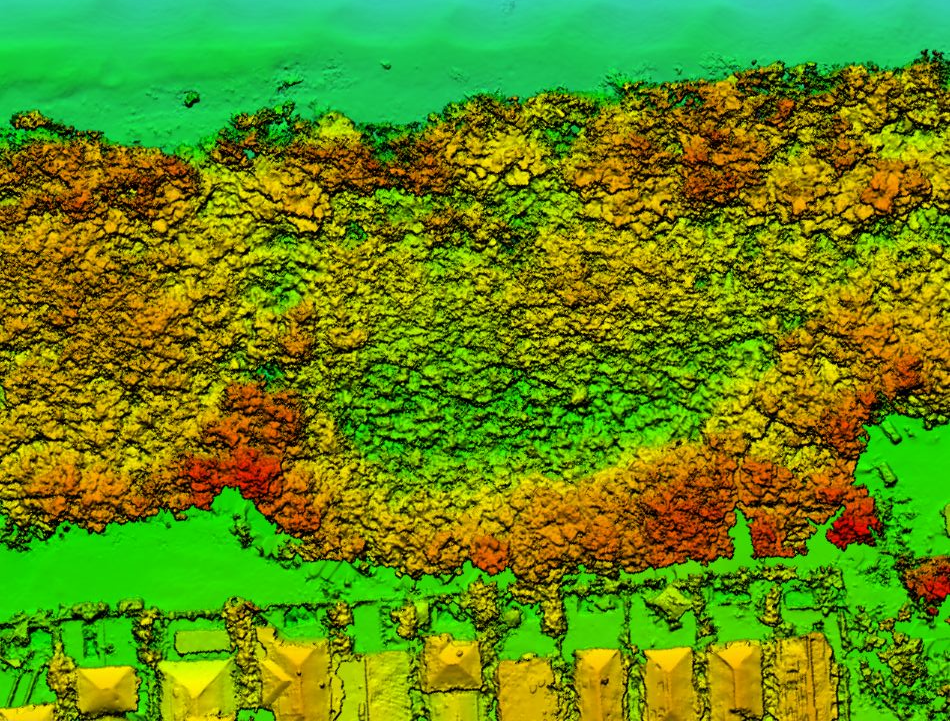
Digital Surface Model
photogrammetry Digital Terrain Model

3D model

Photogrammetry software can also create 3D models with photographs taken from multiple angles, rather than just ‘top down’.

Nadir, or ‘top down’ photos, create a 2.5D orthomosaic and DEM. But when photos are taken from multiple angles, computer algorithms can generate a 3D mesh (like is sometimes used in video games). As a result, orthophotos can be fitted to the mesh surface and represented in three dimensions.


It’s like the difference between viewing Google Maps (2-2.5D) and Google Streetview (3D). Keep in mind however, that if you want to create 3D models from drone data, you need to collect a range of shots from different angles to visualize facades.

Point cloud

Point clouds are large collections of points or coordinates (x, y, z) on an object’s surface. Photogrammetry software can create both sparse and dense point clouds. Sparse point clouds are generated after the initial structure-from-motion steps, whereas dense point clouds are generated after the Multi-View-Stereo/Bundle Adjustment process. In the point cloud below of a coral reef scene, you can see that it almost recreates the surface, but there are black gaps that were hidden from the camera view. The software then ‘fills in’ the gaps to create the DEM or 3D mesh.

What is photogrammetry used for?

The example images above have a very ‘environmental’ flavour. But that’s not the only application for photogrammetry. Did you know that we can use the exact same techniques for crime scene investigation? There are also some fabulous examples of how it’s used to document archaeological artifacts, and habitat diversity on a coral reef.  

Other useful photogrammetry terms

When you first dive into the world of photogrammetry, there are lots of new, unfamiliar terms that you might come across. Here’s a useful glossary for beginners:

SfM is a photogrammetry technique that estimates 3D objects by combining different perspectives of the same object from multiple overlapping 2D images. This process is almost entirely automated through computer vision algorithms, and the end product is a sparse point cloud.

MVS takes the sparse point cloud generated by SfM to create a denser point cloud. It does this by using computer vision algorithms and the structures found in multiple overlapping image pairs. MVS can also be referred to as Bundle Adjustment.

Ground control points are physical markers on the ground with a known GPS location. Processing software can then align capture with these points, improving the georeferenced accuracy of the final output. 

Metadata is the useful information that the drone stores about images taken, including GPS, date, time and image resolution. EXIF (Exchangeable Image File Format) tags in the drone JPG files store this metadata information.  

An RGB camera is just the technical name for a camera that takes photos in visible light. In other words, the Red, Green, and Blue portions of the electromagnetic spectrum.

The Normalized Difference Vegetation Index is a useful tool if you’re working with vegetation. It’s calculated from the information captured by a modified RGB or near infrared sensor and ranks reflectivity of plants on a -1 to +1 scale. Higher reflectivity indicates healthier plants, so NDVI maps are one useful way to monitor vegetation change over time.

RTK is an alternative to GCPs to improve the georeferenced accuracy of images. It allows centimetre-accurate tracking of a drone’s location by using a base station to improve GPS accuracy. It provides better georeferenced accuracy than GCPs and can be useful in environments where placing GCPs isn’t feasible.

You can check out a whole range of beautiful orthomosaics from around the world by launching GeoNadir. If you’d like to learn more about how to capture data suitable for creating orthomosaics, check out our learning resources available on our training page.

Contributed by Taleatha Pell
I recently graduated with a Master of Science in Marine Biology from James Cook University. I am interested in coral reef ecology and using technology including remote operated video and drones to assist in monitoring of marine environments. As a Noongar woman from the southwest of WA I am also interested in how mapping technology can help to incorporate Indigenous knowledges into marine and environmental research. My technical experience in marine research includes benthic and fish surveys, macroalgal removal for restoration, algal cover and bleaching surveys, in water and drone mapping of coral reef environments, coral settlement tile installation and tile analysis, underwater video setup of algal assays including analysis and water quality data analysis.  

Connect with Taleatha here.

Taleatha Pell flying a drone with a remote controller for photogrammetry

Subscribe for more stories from above, tips, & tricks

Share this article with your peers on social media.

Facebook
Twitter
LinkedIn
Topographic map with dots displaying data points of environmental drone mapping data. Three drone mapping overlays in different environments

Get a free account

  • Unlimited orthomosaics
  • Unlimited uploads
  • Free storage
Manage, process, analyze, and collaborate with your drone mapping data.