While multispectral imaging may have been developed as a military surveillance technique, these days its benefits are far more wide ranging. From Earth observation sensors on satellites to laboratory based systems, they can be deployed to detect, identify, and measure features invisible to the human eye at a variety of scales. Let’s look at how multispectral drone mapping aids environmental monitoring and management.
Contents
Understanding multispectral imaging
Our human vision system is optimised to see light across the visible portion of the electromagnetic spectrum. Basically this means that we can see red, green, and blue light, and all the mixtures in between to make up the rainbow. But we can’t see ultraviolet light, x-rays, gamma rays, thermal infrared, microwaves, etc. Fundamentally though, they are all just different types of energy, with different frequencies.
Multispectral systems allow us to measure and ‘see’ more than the three primary colours of red, green, and blue. This is important because there are many features in nature that may look the same as each other to the naked eye, but quite different in these invisible wavelengths. Think of it as granting us superpowers!
To understand more about the different types of sensors, check out this blog.
What can we ‘see’ in multispectral data?
This all depends on which wavelengths we are looking at. Perhaps the most commonly used invisible wavelengths are those in the near infra-red (NIR) region. These wavelengths are great for helping us to understand vegetation health and biomass, particularly useful for agricultural mapping. Multispectral sensors can also incorporate the shortwave infra-red (SWIR) wavelengths, which we use to assess vegetation and soil moisture.
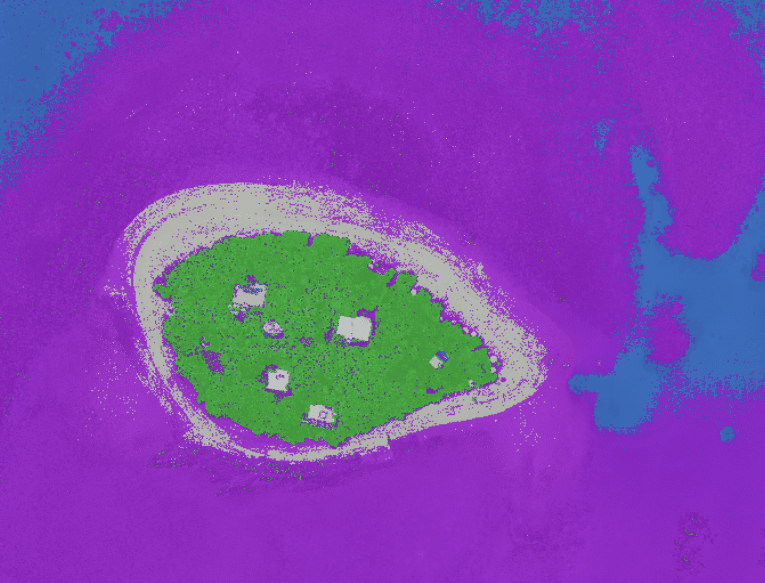
The tricky thing to understand is that computers can only display red, green, and blue, just as our eyes are tuned to detect these colours. So that means if we want to ‘see’ the invisible, we need to paint it with red, green, or blue. Check out the image below for example. You can see it the way our eyes see it, where trees are green, or you can visualise the NIR (‘painted’) as red, which really makes the trees and grass pop. Check out TERN on GeoNadir for this dataset and more.
 False colour NIR,R,G
 True colour R,G,B
Multispectral drone mapping isn’t just for land based environments either. You can see in the images below just how different a coral reef looks when viewed through the lens of ‘invisible’ data. The vibrant red on the false colour image of the reef here shows lots of live coral, while it’s hard to see that in the mix of browns in the standard visible data.
There’s always a trade off though. To get the additional spectral information, you have to sacrifice the spatial detail. This is important if what you are trying to detect, measure, or identify is very small.
 False colour NIR,R,G
 True colour R,G,B
The multispectral drone mapping process
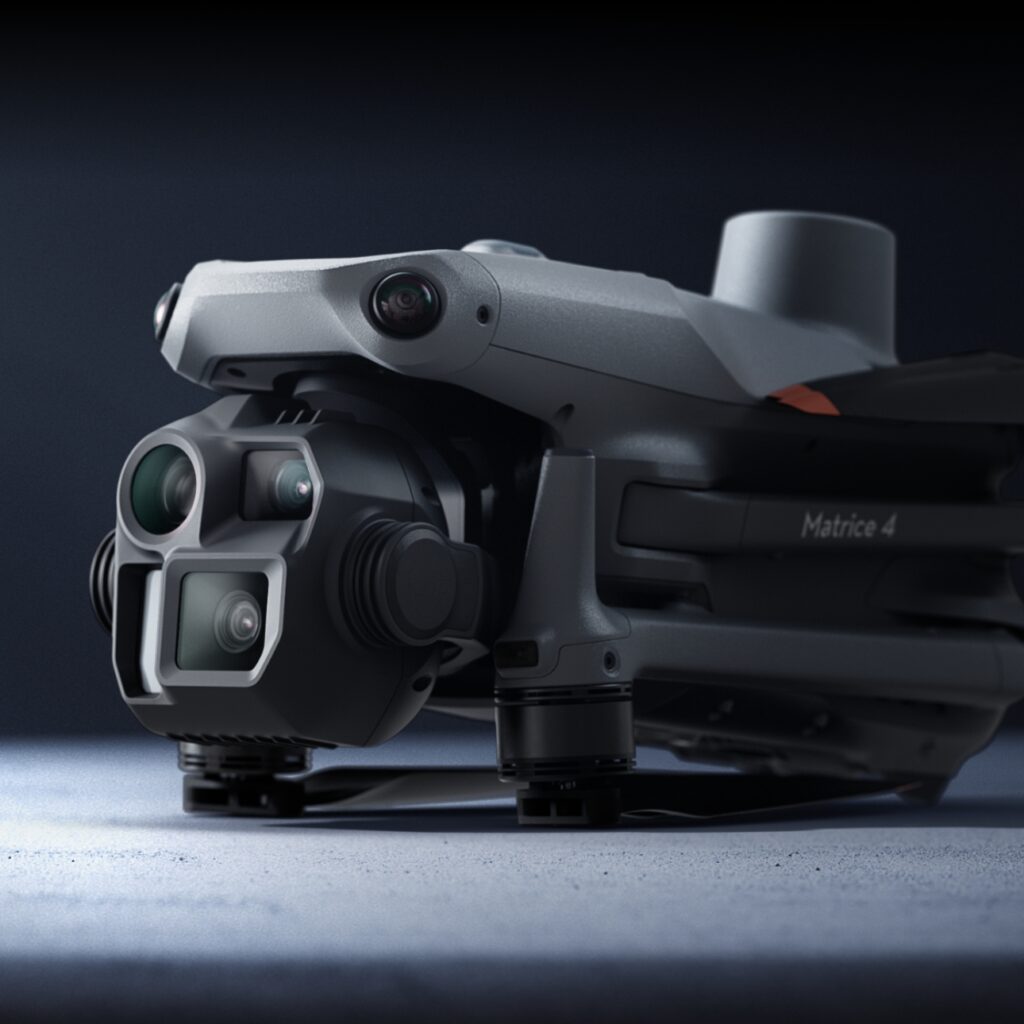
Multispectral drone mapping has become increasingly accessible. Drones with built-in multispectral cameras or the option to attach multispectral payloads are readily available. There are a number of small multispectral cameras on the market that have been designed to deploy on drone platforms.
Once you have the hardware sorted, capturing the data is the same as with a standard RGB camera on a drone. You need a mission planning app that is designed to capture your photos in a systematic manner with high overlap between photos.
After you’ve completed your capture, it’s important to be ready to manage and process the data. If you might normally take 500 RGB photos to cover your site, you will now have multiples of that 500 – one for every ‘colour’ or wavelength captured. So if you have a multispectral camera with green, red, red edge, and NIR bands, over that same area you would have your 500 RGB images, plus another 2,000 multispectral ones. Platforms like GeoNadir specialize in managing and processing this type of data.
Analyzing multispectral drone maps
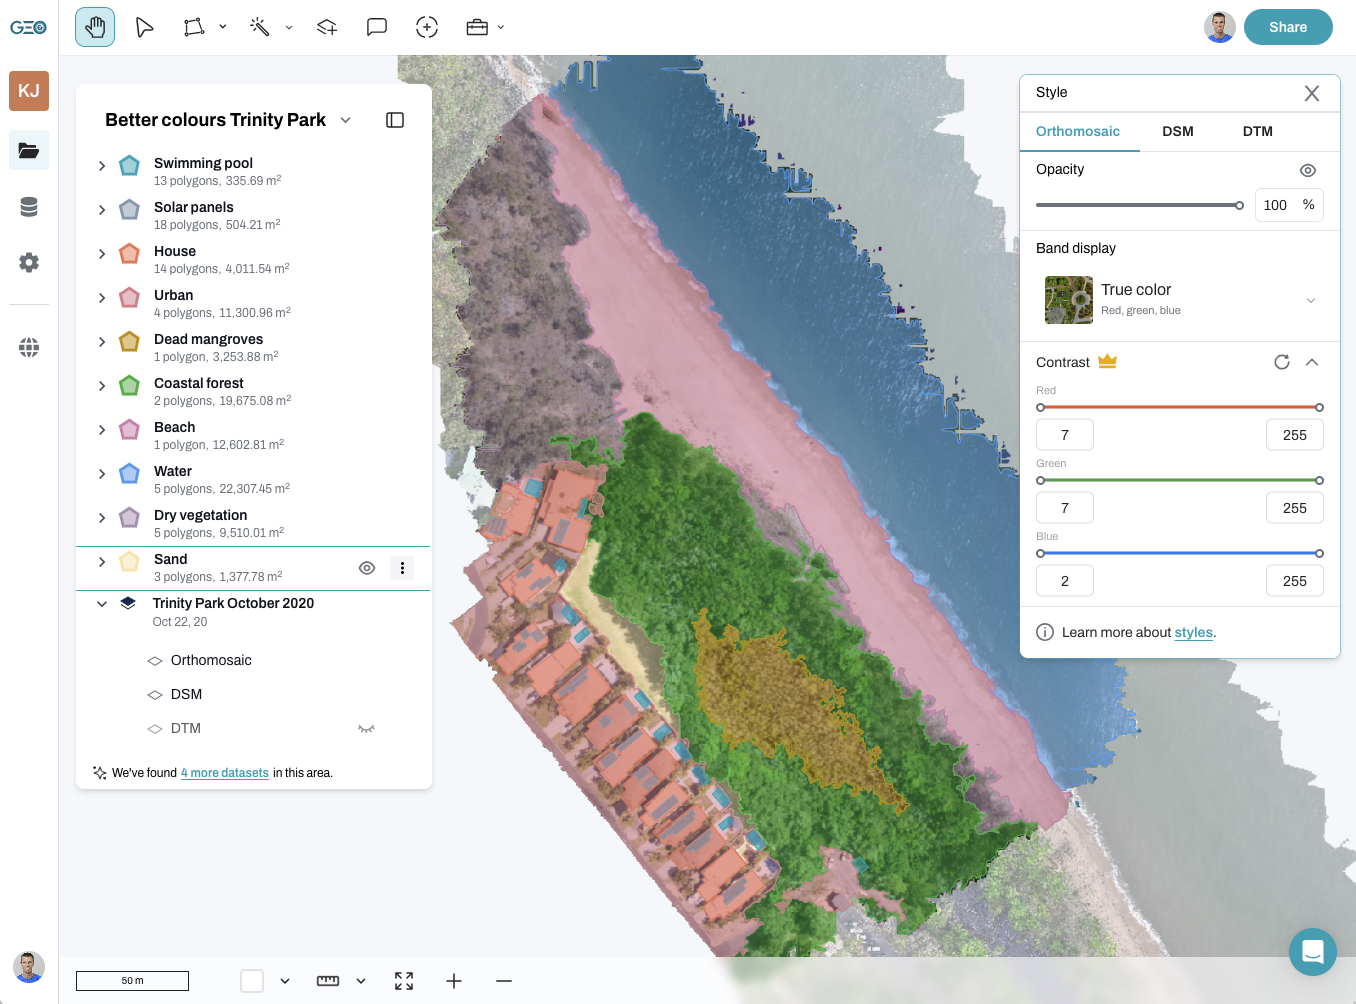
At the most basic level, you will need to create an orthomosaic of your data. If you process through GeoNadir, you will have access to an RGB orthomosaic (if RGB was uploaded), as well as the multispectral orthomosaic. You will also be able to use the digital surface model (DSM) and digital terrain model (DTM). Whichever software you choose, make sure that you have the ability to download the processed products, as we are not aware of software dedicated to drone mapping that can adequately visualize and manipulate multispectral data. GeoNadir supports you to download as we know how valuable multispectral information is, and there are other software packages that are best suited to exploit it.
Understanding multispectral data can be challenging. It’s certainly far easier to capture than it is to analyze! If you really want to dig into it, you’ll need to get some specialized image processing software. There are several on the market in both the cloud and desktop space. Options are ENVI, Erdas Imagine, Google Earth Engine, eCognition, and also the more hybrid image processing / GIS packages like QGIS and ArcGIS Pro.
Importantly, there’s far more to multispectral data than being able to derive an NDVI! But if you do want to understand more about the NDVI, here’s an animated video about it below.
If you would like to delve more into the world of remote sensing and multispectral or hyperspectral imaging, visit my youtube channel for many video tutorials.
If you enjoyed this blog, also check out


