

Is your team set up to treat it that way?
If you’re an environmental manager at a mine, you’re probably well across what a Rehabilitation Management Plan (RMP) or a Progressive Rehabilitation and Closure Plan (PRCP) requires of you. Documentation, completion criteria, reporting cycles, annual sign-off from an Accredited Qualified Person.
What’s less clear, and what we hear consistently from environmental teams, is how to actually build and sustain the spatial evidence base that gives those reports real weight.
Rehabilitation management plans and their equivalents are still relatively new. The regulatory frameworks landed in the early 2020s, and the sector is still working out what “good” looks like in practice. Meanwhile, environmental teams are expected to demonstrate progressive rehabilitation compliance across hundreds of hectares, year after year, with limited resourcing, limited ecologist availability, and a spatial data challenge that no one quite prepared them for.
Spatial data has been at your mine for years. Just not for you.
Mining operations are not short on spatial data. Survey teams, geotechnical teams, and operational planning functions have been using drone imagery, LiDAR, and GIS tools for years. The data infrastructure, workflows exist, and people who know how to fly a drone and process the outputs exist.
But that data has historically been collected and managed for operational purposes such as blast design, haulage road planning, stockpile volumes.
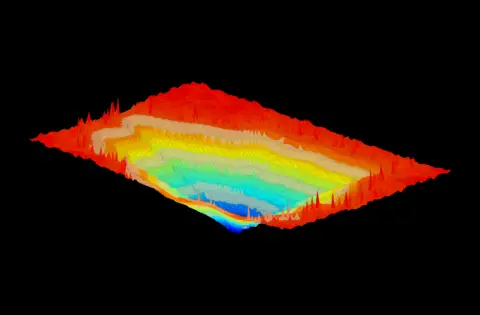
Environmental applications are an emerging use case within mining, and the reporting formats needed for rehabilitation compliance are different to anything operations have been doing with that data.
What we regularly find when we start working with an environmental team is that there’s actually quite a lot of spatial data sitting somewhere, but it’s been processed for operational outputs rather than environmental ones, and never quite turned into something that can support a compliance report.
So if the data exists, the question is how can you get it organised, processed, and interpreted in a way that’s useful to you and defensible to a regulator. That’s the gap we help close, and it’s less about technology than it is about workflow. Knowing what to capture, when to capture it, how to store it so you can find it in two years, and how to extract the specific outputs your rehabilitation management plan requires.
The annual ecologist visit isn’t the problem. It’s what happens either side of it.
There’s also a shortage of experienced ecologists available for mine rehabilitation work. That’s not news to anyone managing an AQP relationship. Timing is competitive, costs are significant, and the window for a site visit is often narrower than you’d like. But the bigger challenge isn’t the visit itself, it’s the context around it.
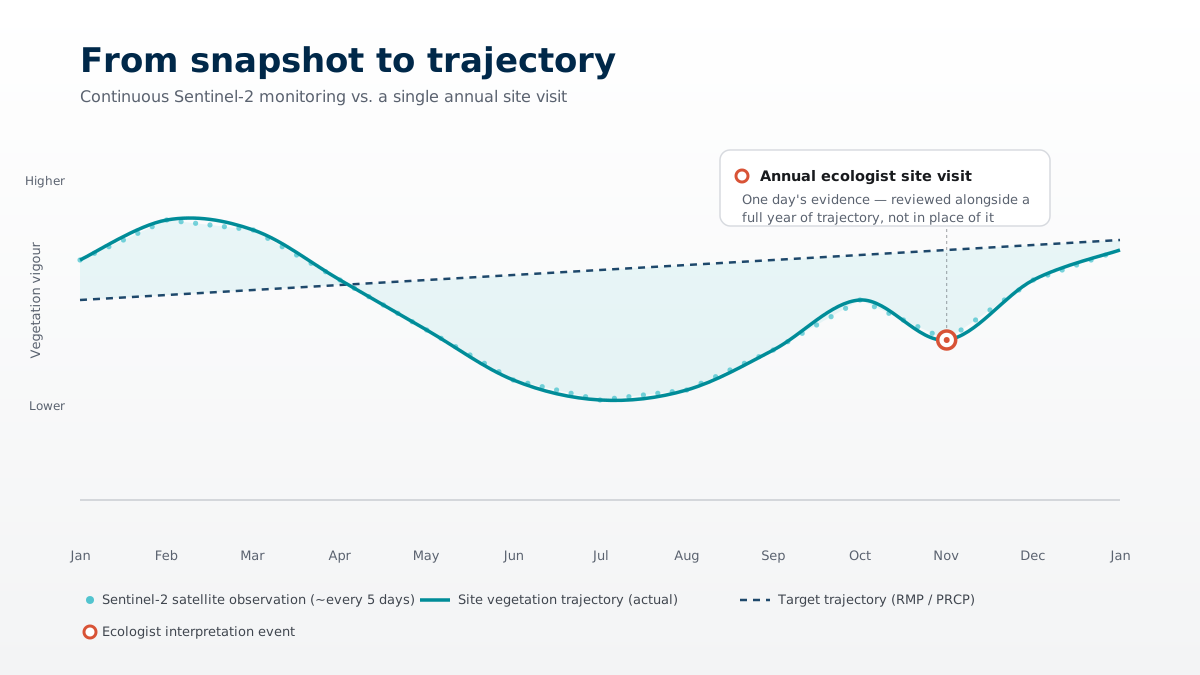
An ecologist arriving on site for an annual inspection is working with what they can see on the day – a snapshot. And as anyone who’s watched a rehabilitation area respond to a wet season, a drought, or a late rainfall event knows, what you see on a given day can be a very incomplete picture of how a site is actually tracking.
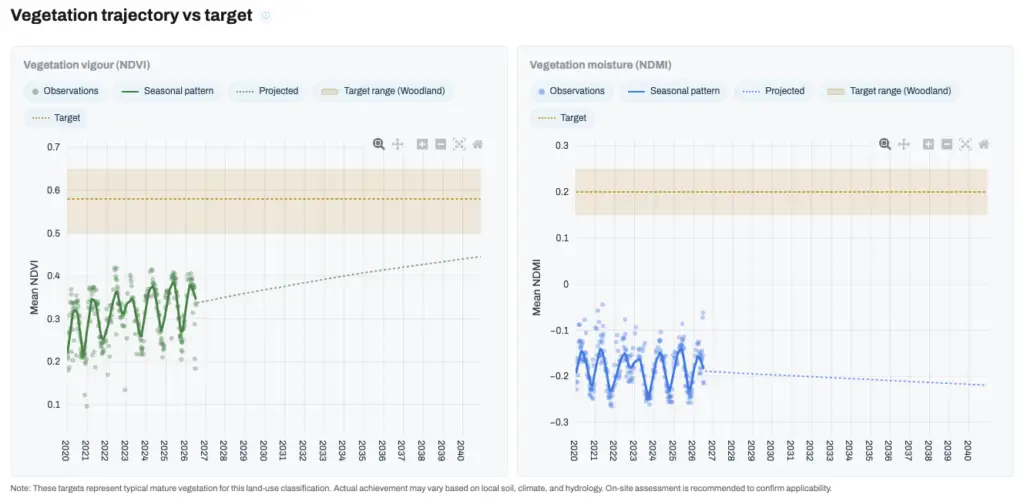
What’s missing from most annual reporting cycles is the trajectory – the evidence of how a site has been behaving across the full year. Is vegetation responding to seasonal cycles the way you’d expect? Is it recovering after stress events? Is it moving closer to the target condition your rehabilitation plan describes, or is there a divergence emerging that won’t be visible until it’s a problem?
That kind of evidence doesn’t come from a single inspection. It comes from continuous observation, and that’s exactly what satellite time-series data provides. Sentinel-2 imagery captures your site every few days, and over months and years, that data tells a story about vegetation vigour, moisture, and trajectory that no point-in-time survey can replicate.
The opportunity here is to stop treating the ecologist visit as the primary evidence event and start treating it as the interpretation event, where a qualified ecology professional reviews a body of evidence that’s already been accumulating, asks questions that are better informed, and focuses their on-ground time where it matters most.
That’s a better use of their time. It’s also a more defensible compliance outcome.
What decision-ready actually looks like
We talk a lot in this industry about data. Less often about what environmental teams actually need from that data on a day-to-day basis. The environmental managers we work with aren’t looking for another dashboard or another data file to interrogate. They need to know:
- Which of my rehabilitation areas is tracking well and which ones need attention?
- Am I meeting my slope and erosion thresholds, or do I have exceedances I need to act on?
- Is my vegetation cover moving toward my rehabilitation completion criteria, or am I at risk of falling short?
- If a regulator asks me to justify my compliance position, can I point to evidence that’s been building over time, not just last year’s report?
Those are practical, urgent questions, and they require outputs that are structured around your rehabilitation completion criteria, not just maps and indices.
This is the distinction we try to hold in everything we do: geospatial data is only valuable to an environmental team if it’s been processed, analysed, and presented in a way that connects directly to the decisions they need to make. Wall-to-wall site coverage, priority areas ranked for intervention, vegetation trajectories compared against analogue sites, slope exceedance statistics ready for reporting.
Not raw data. Decision-ready outputs.

The opportunity is real, if you move early
Rehabilitation management plans are life-of-mine documents. The completion criteria you’re being held to have been agreed with the regulator. The trajectory toward those criteria needs to be demonstrable, not just at closure, but progressively, year by year.
That means the environmental teams that start building a continuous, well-organised spatial evidence base now are in a fundamentally different position in five years’ time than the ones still relying on point-in-time assessments. Not just from a compliance standpoint, but from an operational one: earlier detection of issues means cheaper interventions. Better spatial organisation means less time recreating the wheel each year. Continuous evidence means your ecologist’s time goes further.
There’s also something worth naming about the position environmental teams are in right now. The regulatory expectations are increasing, the scrutiny on rehabilitation outcomes is increasing, and the teams responsible for delivering those outcomes are often under-resourced relative to the operational teams around them.
Better spatial data practice is one of the most practical ways to shift that dynamic to build the internal capability and evidence base that lets your team demonstrate, with confidence, that your rehabilitation program is on track.
Where GeoNadir fits in
We work with mining environmental teams to turn their existing drone, survey plane, and satellite data into the spatial evidence base their rehabilitation management plans require, and to build the workflows that make that sustainable over time.
That means processing drone datasets into orthomosaics, DSMs, and DTMs structured around your assessment zones. Making the LiDAR data from the survey plane flyovers accessible for analysis. Running Sentinel-2 time-series analysis. We then use all this data to: establish vegetation trajectories and analogue comparisons; deliver slope exceedance and erosion risk reports; run vegetation cover assessments; and work with you to produce weed detection outputs. All of this is aligned to your completion criteria.
It also means helping your team understand how to manage and use this data internally, so that the next data capture campaigns are captured right, stored right, and actually usable twelve months later when you need it.
We typically start with a structured 12-week pilot that validates our workflows against your specific rehabilitation management plan requirements before committing to an ongoing monitoring program. It’s designed to give you confidence in the outputs before you build them into your annual reporting cycle.
If you would like to discuss your rehabilitation management plan and how spatial data can be best used, book a call here with one of our team.