In my previous blog, I argued that focusing on “seeing weeds” can miss key outcomes of rehabilitation monitoring. Not because weeds don’t matter, but because hyperfocus on a single component of the ecosystem at a single moment tells us surprisingly little about whether a system is proceeding towards its desired state and our rehabilitation efforts are succeeding.
That raises a more important question:
If not the tangibility of weeds, then what does good rehabilitation actually look like?
And more specifically, what does it look like over time? And how do we better understand and respond to the ecosystem trends?
Rehabilitation is a process, not a state
One of the quiet traps in rehabilitation monitoring (and not just for ecosystems either…) is the idea that there is a point at which a site is rehabilitated. Tick that box, done!
In reality, rehabilitation is a process of transition. Systems move from disturbance toward stability, passing through phases of establishment, consolidation, and maturation. Along the way, they fluctuate. They respond to seasons. They respond to stress. They sometimes move backwards before they move forwards again.
Good rehabilitation is therefore not defined by how a site looks on a particular day, but by how it behaves across many days, seasons, and years.
And yes, weeds may be one component of that. But it doesn’t mean to say that counting and identifying species is necessarily the answer either.
The importance of seasonal behaviour
One of the strongest indicators of system function is how vegetation responds to normal seasonal cycles.
In functioning systems, growth and senescence tend to follow predictable patterns driven by rainfall, temperature, and day length. There is variation from year to year (climate change will affect this), but it sits within an expected envelope.
Early-stage rehabilitation areas often show exaggerated responses – rapid green-up after rainfall, followed by equally rapid decline. Over time, as soils develop and plant communities establish, these responses usually become more moderated and more consistent.
This moderation is a sign of increasing resilience.
A snapshot image can capture ‘greenness’ or even species distribution, but it cannot tell you whether that greenness is fleeting or sustained.
Further, an ill-timed snapshot may completely miss the presence of certain species of interest.
Recovery after stress matters more than peak condition
Another defining feature of good rehabilitation is how systems respond to stress.
Droughts, heatwaves, and extreme rainfall events are not exceptions. They are part of the operating environment. A system that only looks good in favourable conditions is not a robust one.
Healthy or well-functioning systems tend to:
decline during stress events;
recover afterward at a rate consistent with their surrounding environment (or compared to analogue sites); and
return toward their previous condition rather than resetting entirely.
By contrast, systems at risk often show delayed recovery, incomplete recovery, or increasing sensitivity to each new stress event.
These patterns are rarely obvious in single surveys. They emerge only when observations are stitched together through time, and with suitable observation frequency.
Stability does not mean sameness
A common misconception is that stability implies uniformity.
In ecological systems, stability usually means the opposite: variability within bounds.
As rehabilitation progresses, good systems tend to show:
reduced extreme swings;
more consistent responses year to year; and
fewer abrupt internal contrasts.
Importantly, they do not stop changing. They simply change and respond in more predictable ways.
Monitoring approaches that focus on isolated observations can mistake normal variability for failure, or miss early warning signs of instability.
Context and comparison matters
It is difficult to judge rehabilitation in isolation.
Climate variability alone can make one year look wildly different from the next. Without context, it becomes hard to tell whether a change reflects progress, setback, or simply local weather.
This is why comparison is so important.
Good rehabilitation does not need to look identical to surrounding undisturbed land. But over time, it should begin to behave in similar ways, responding to seasons and stress in broadly comparable patterns.
When rehabilitated areas consistently diverge from nearby reference systems under the same conditions, that divergence is meaningful.
From snapshots to trends and trajectories
Taken together, these characteristics point to a simple shift in perspective.
Good rehabilitation is not defined by peak condition, species presence, or momentary appearance. It is defined by behaviour and direction.
Is the system becoming more stable? Is its response to seasons becoming more consistent? Is its recovery after stress improving?
These are trend and trajectory questions, not visibility questions.
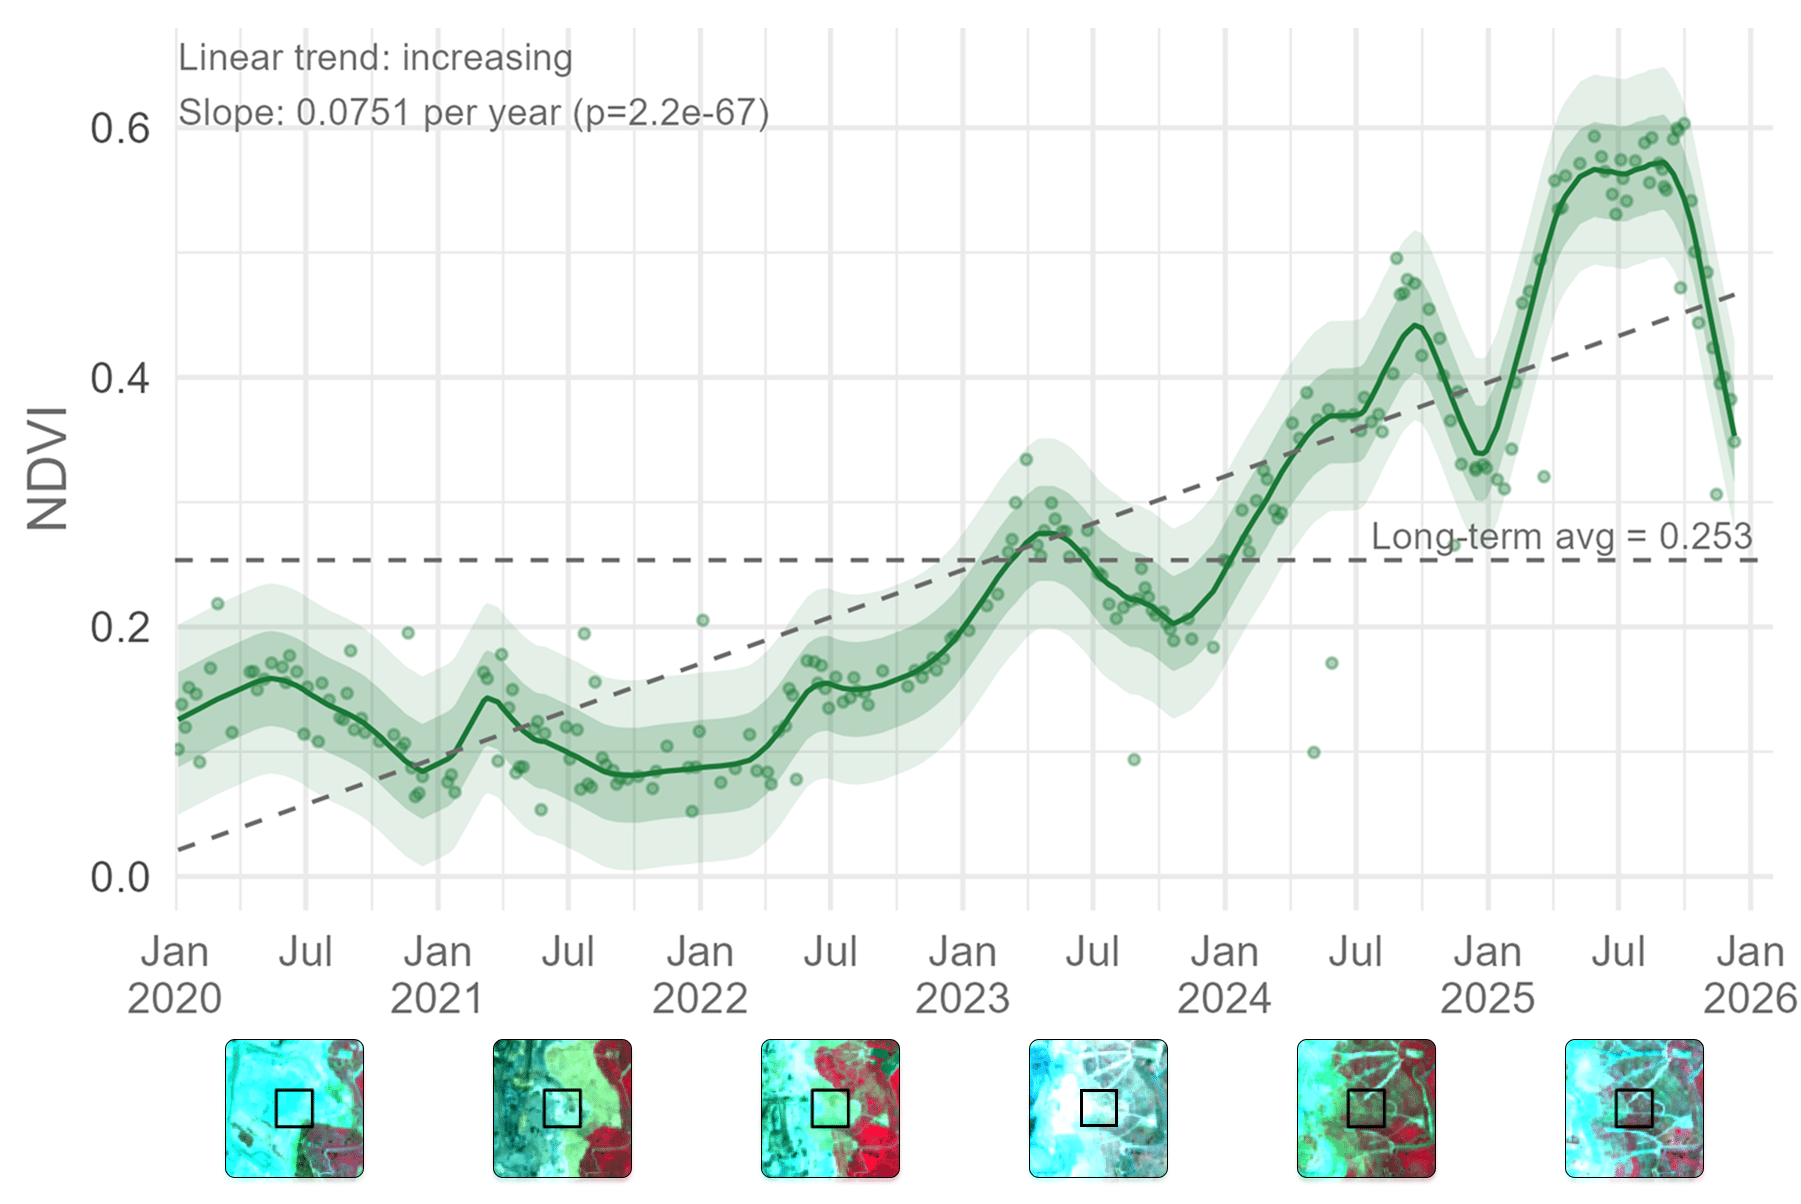
Check out this graph for example, based on a rehabilitation site in Australia, and using NDVI values derived from Sentinel-2 data. What I want you to notice though is that it’s not about absolute NDVI values, or about identifying species. It’s about direction, stability, and response to seasons. And how observing in this way allows us to join the dots between single snapshots.
Asking the right follow-up questions
Once monitoring focuses on behaviour through time, different and often more useful questions emerge:
Where are systems improving steadily, even if slowly?
Where are they plateauing?
Where are they becoming more volatile or diverging from reference behaviour?
These questions support earlier intervention, more targeted fieldwork, and more defensible decision-making.
They also align closely with how rehabilitation success is actually assessed – through evidence of progress, resilience, and sustainability rather than perfection.
In the next post, I’ll look more closely at one of the most powerful tools for answering these questions: comparing rehabilitated areas to their analogue sites, and what it really means for a system to behave like its reference.