
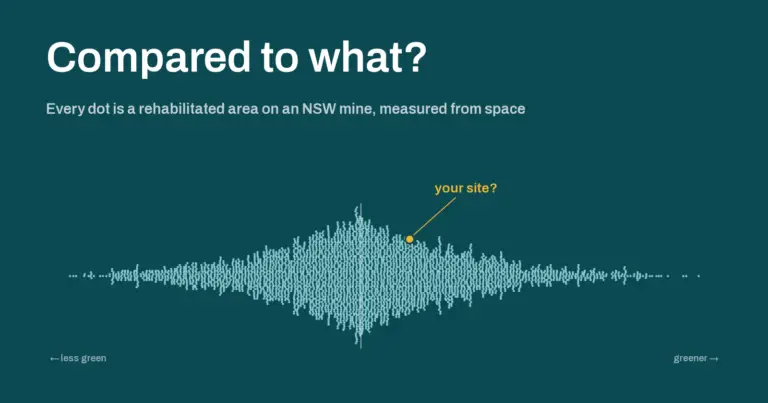
“Is our rehab doing well?” is a harder question than it sounds, because the honest answer is always “compared to what?” So we compared it to everyone. Using only public data and free satellite imagery, we measured about 4,000 areas in various stages of rehabilitation across 72 NSW mines, and built a way to line any one of them up against fair peers.
This is part 1 of a series on what public data can tell us about mine rehabilitation across New South Wales.
Contents
Compared to what?
Most rehab monitoring compares a site with itself, or with a handful of reference sites next door. That’s useful. Reference sites tell you what the local landscape does in a wet year and a dry one.
But it leaves a big question unanswered. Is three-year-old native rehab on this mine greening up about as fast as three-year-old native rehab on other mines? Is it slower? Faster? Nobody could really say, because nobody had looked at all of it at once.
It turns out you don’t need anyone’s private data to start. You just need to put three public things together.
Ingredient one: the regulator’s maps
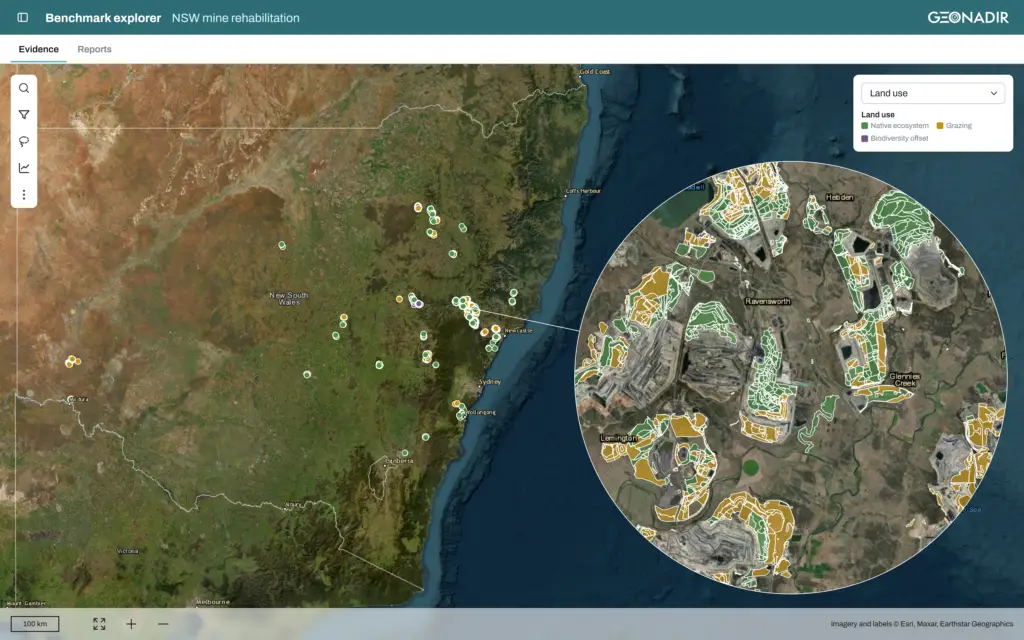
Every NSW mine reports its rehabilitation to the Resources Regulator each year, and those maps are public. There are two layers, and neither answers the question on its own:
- the annual rehabilitation submissions say what phase an area is in and when it was established, but not what it’s meant to become
- the final land use maps say what each area is planned to become (native ecosystem, grazing, and so on), but not its phase or age
Lay one over the other and the map splits into what we call pieces: areas with exactly one land use, one phase, one establishment year, and one mine. That gave us 11,902 pieces.
Then came the unglamorous bit. About 3,700 of them were slivers smaller than a hundredth of a hectare, where two boundaries almost line up – it’s quite the topology nightmare to be honest! Others had no establishment year, weren’t vegetated land uses, or were too small to measure with 10 m pixels. After cleaning, we had about 4,200 pieces covering roughly 25,000 hectares.
Of note: only about 27,000 of the roughly 94,000 hectares of mapped final land use has a matching rehabilitation record. The rest is either not rehabilitated yet, or not recorded in a way that lines up. (More on what the public data can and can’t tell us in a later post.)
Ingredient two: a satellite that never stops looking
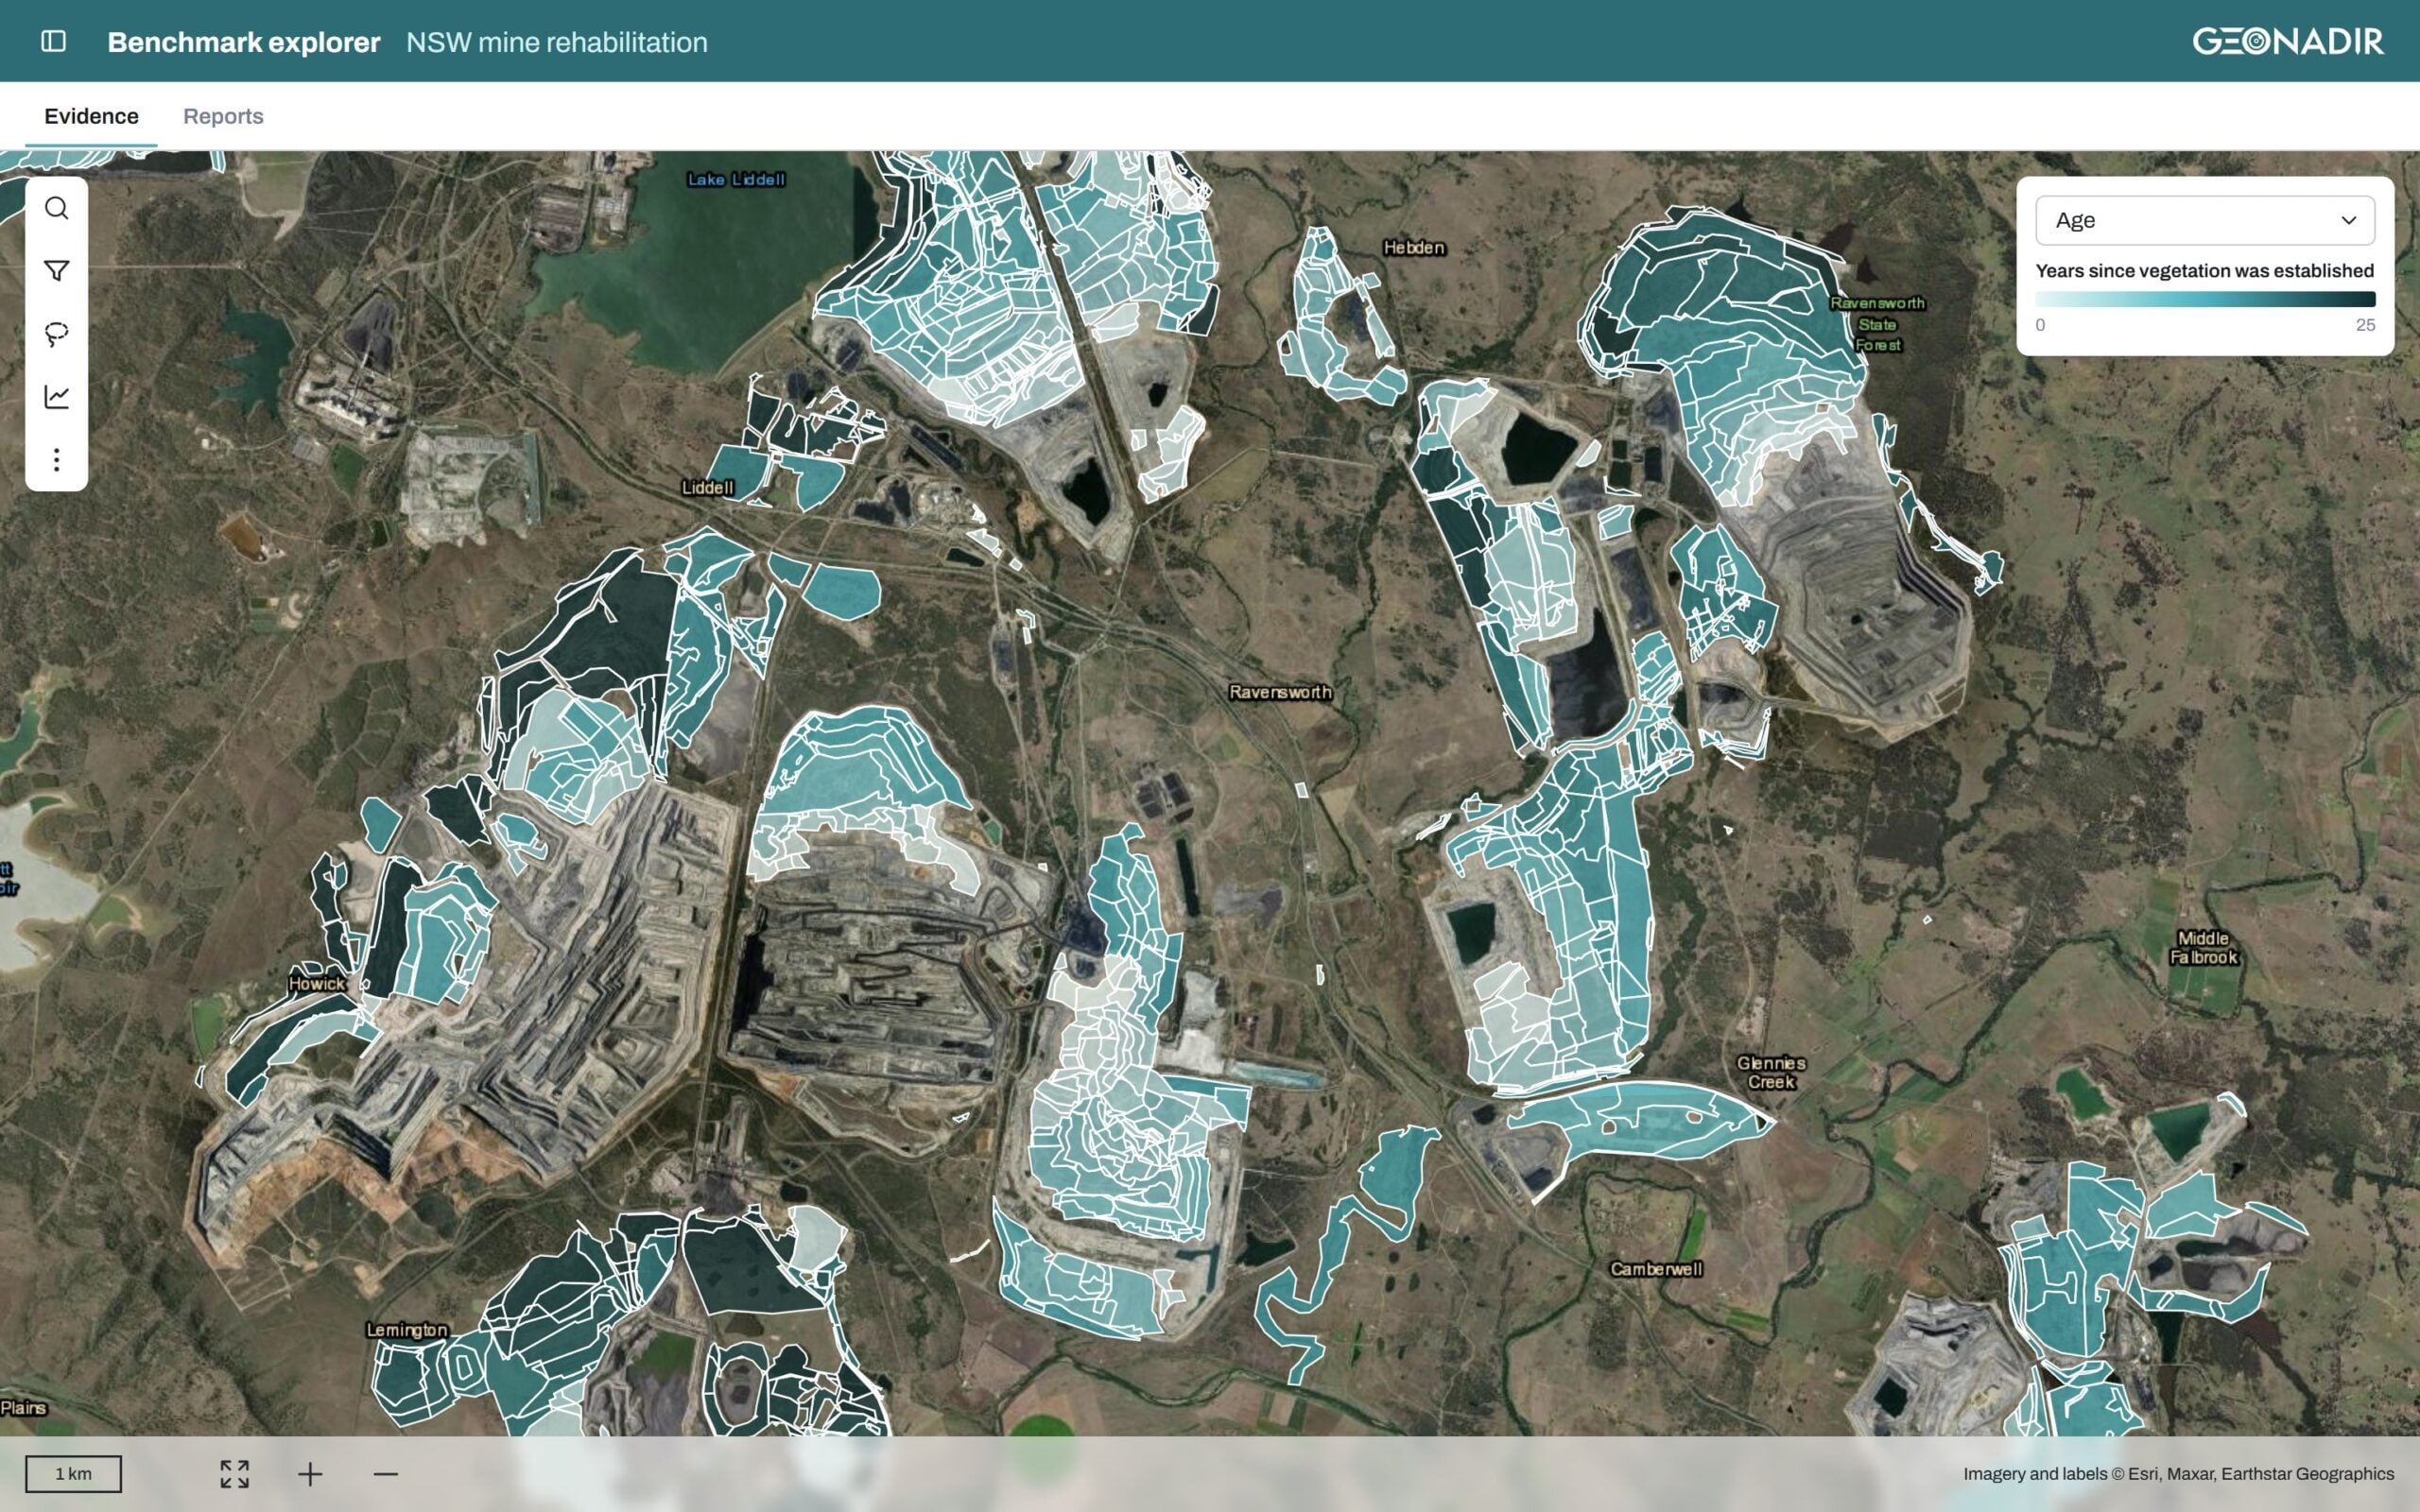
The European Space Agency’s Sentinel-2 satellites image every part of NSW every few days, at 10 m resolution, and the data are free to access.
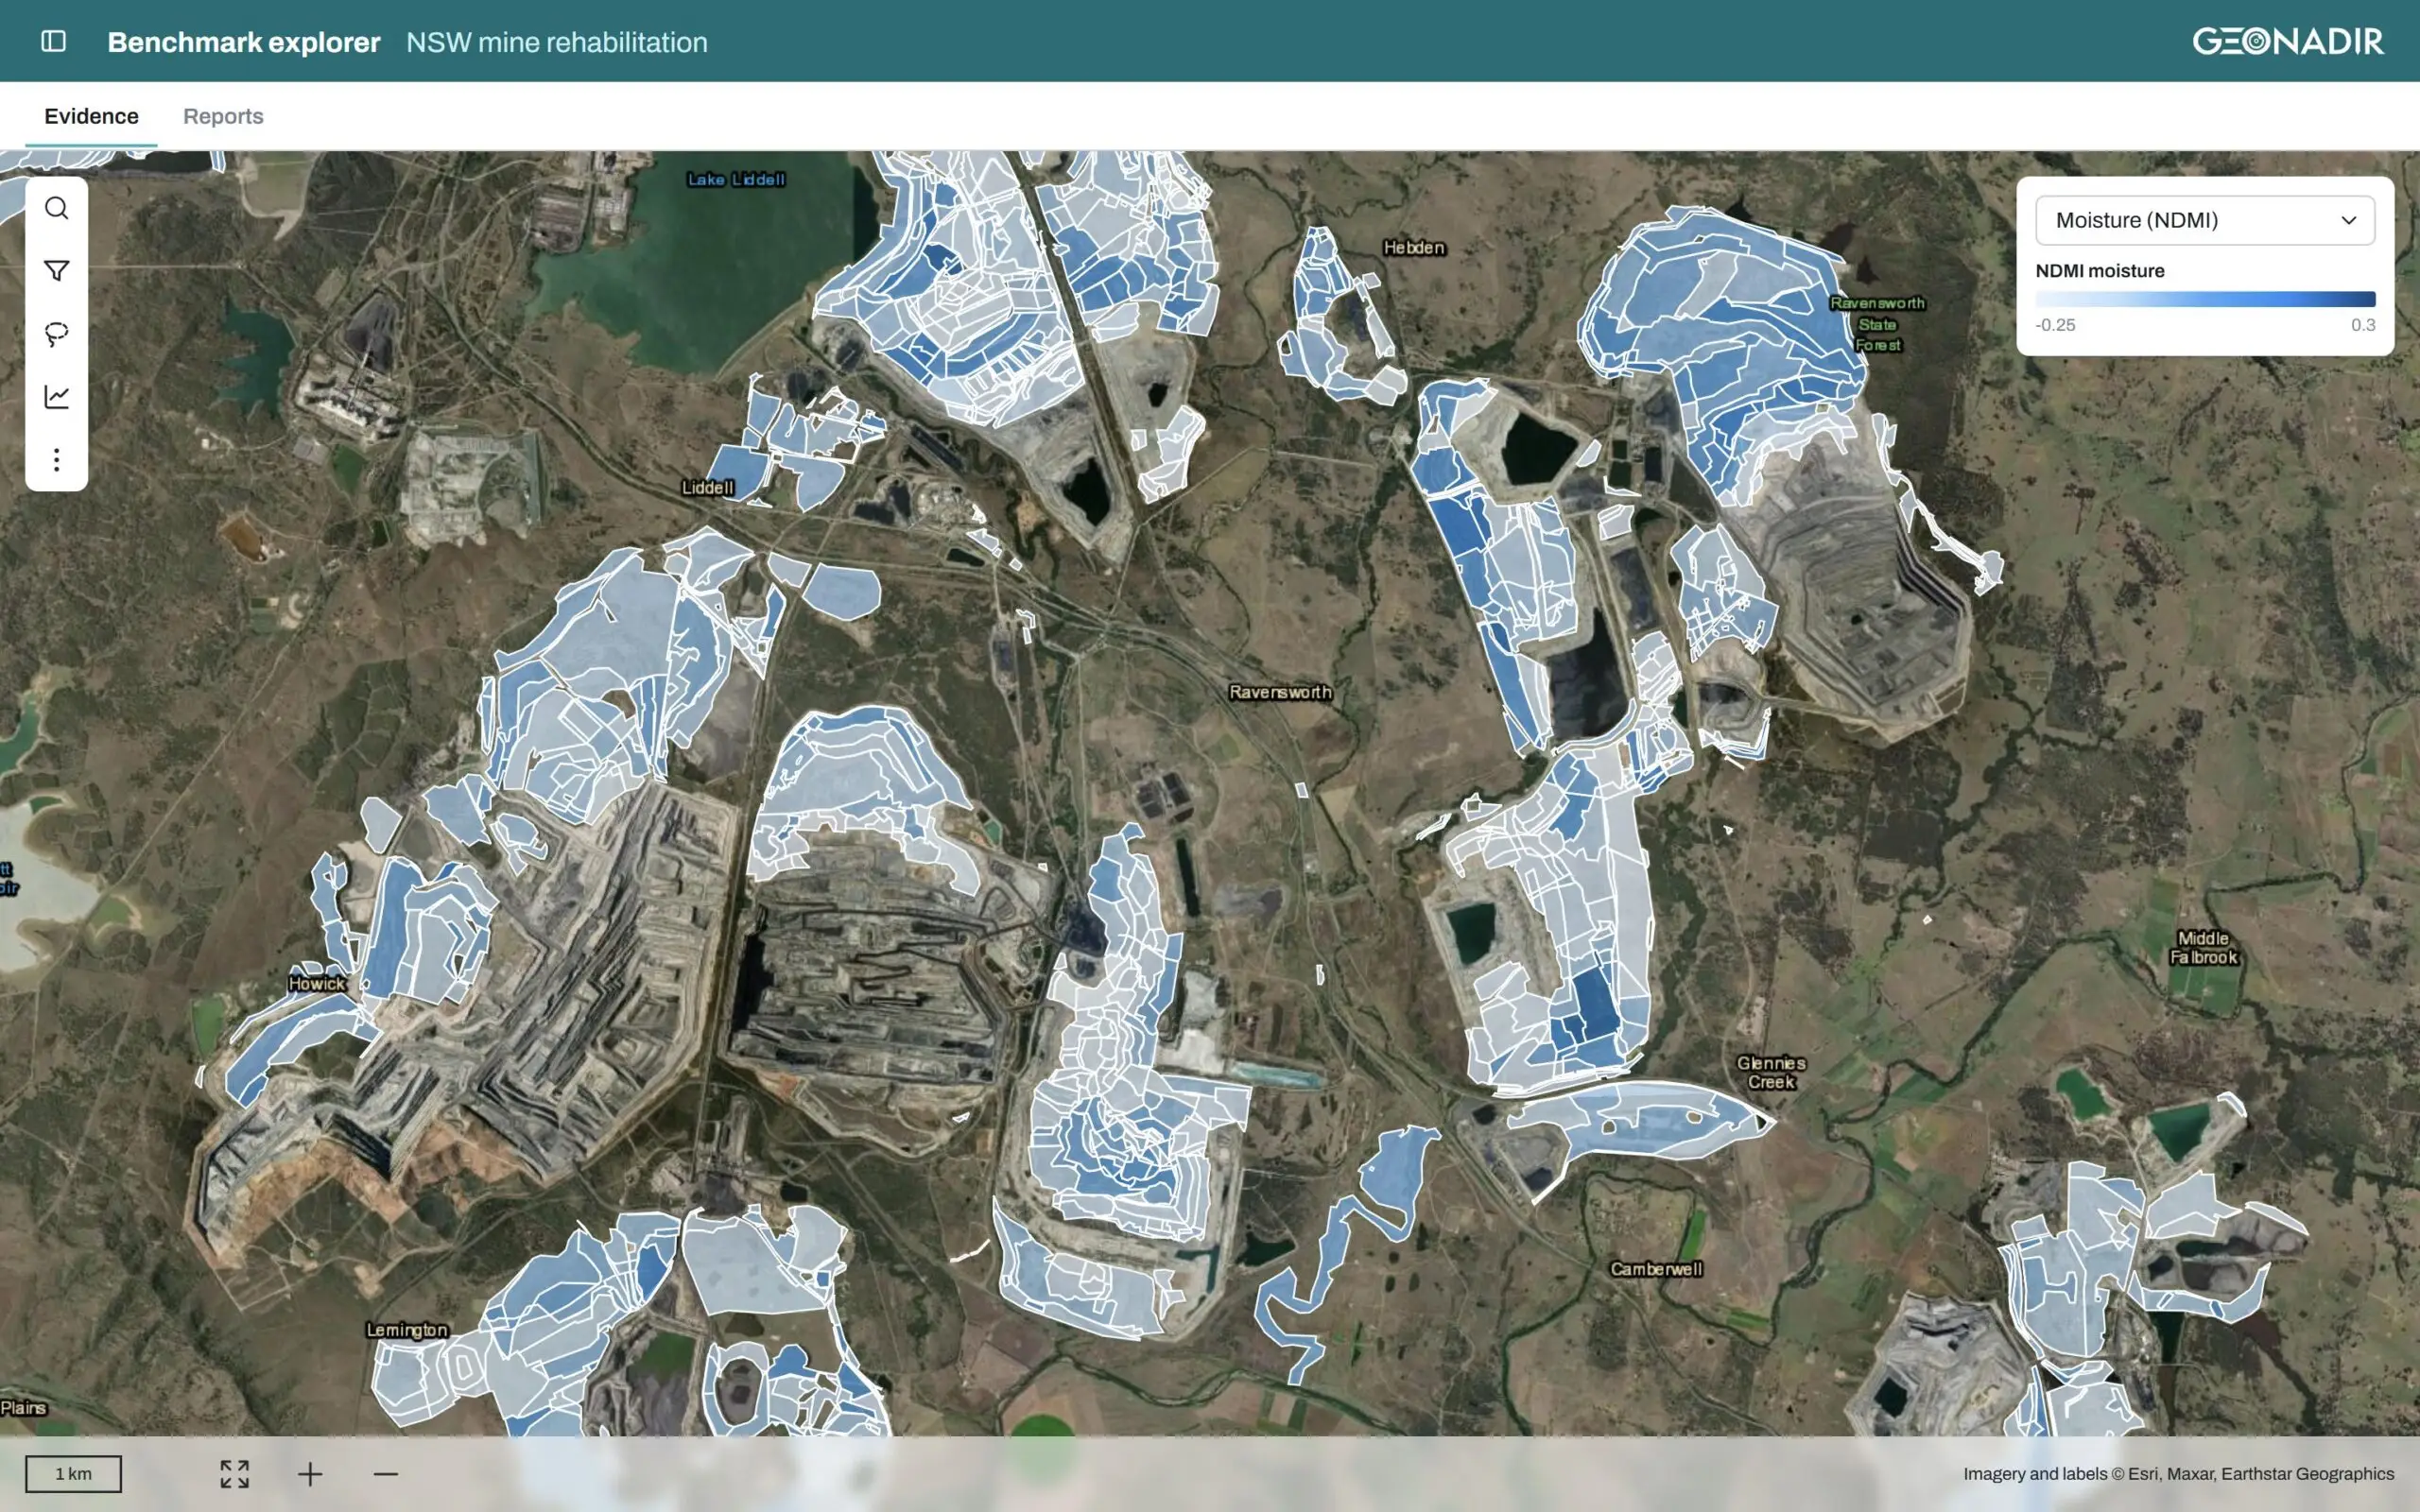
For every piece, we read every clear scene from March 2020 onwards. (We started in March because January and February 2020 had significant bushfire smoke contamination.) Clouds are masked out, hazy dates are dropped, and each piece gets two numbers per scene:
- NDVI, a measure of greenness
- NDMI, a measure of how much moisture the vegetation is holding
That’s about 1.5 million piece-by-date measurements. They’re calculated the same way as in our vegetation trajectory reports, so a mine’s own site lines up against the state with no translation needed.
Ingredient three: the weather
Every piece also gets its long-term rainfall and drought context from the Queensland Government’s SILO climate database. That matters, because a site that gets 550 mm of rain per year shouldn’t be judged against one that gets 900.
Making comparisons fair
This is where most of the thinking went. A benchmark is only useful if the comparison is fair, so every comparison follows the same rules:
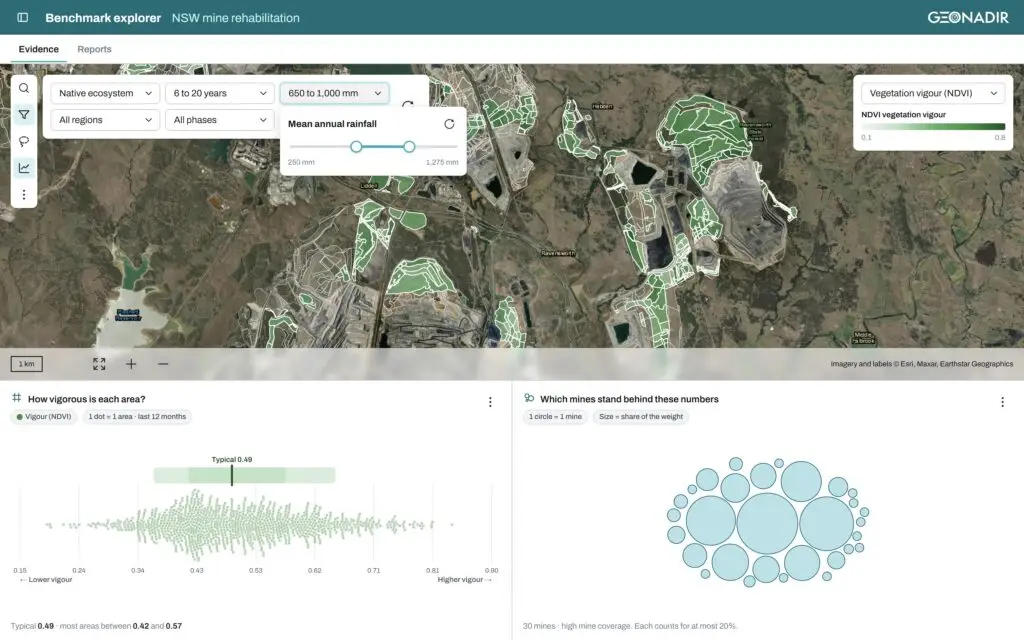
- Same final land use. We only compare like land uses, so native ecosystem with native ecosystem. Grazing with grazing.
- Similar age. We compare within a year of the same time since establishment.
- Other mines only. A mine is never benchmarked against itself.
- Enough company. At least 10 pieces from at least 3 mines, or we don’t give a benchmark number at all.
- No mine dominates. No single mine can count for more than 20% of a group, so one big operation can’t set the bar for everyone.
You can narrow the group further by region, by similar rainfall (within 20% of your own), or by commodity. If a group gets too small to be meaningful, it says so and suggests the nearest wider group instead of guessing.
What a benchmark is, and what it isn’t
The output is a percentile indicating where a piece sits among its peers. The 80th percentile means it’s greener than about 80% of comparable areas at other mines. It does not mean “better”. Greenness isn’t ecosystem quality. Lush pasture can easily out-green an open woodland that’s doing exactly what it should.
Further, a satellite can’t give you a species list, and none of this replaces the completion criteria in your rehab plan. What it does give you is context: whether your site is in the normal range for its kind, ahead of it, or behind it, and how sure we can be given how many mines sit behind the number.
When we walked the regulator through it, one of the first cautions was about the phase data. The phase is what each mine reports, and many sites are conservative about moving areas out of establishment. So we treat phase as a reporting choice, not a measurement.
What’s coming in this series
Building this threw up some findings we didn’t expect. Over the next few posts we’ll dig into:
- Sign-off doesn’t mean top of the class. Where areas the regulator has signed off actually sit against their peers.
- Your phase is a choice, not a measurement. Why two areas of the same age can sit in completely different phases.
- When everyone has a bad year. Why a falling trend often says more about the weather than about the rehabilitation.
- What the public data can’t tell us. The gaps, slivers, and empty fields, and what would make everyone’s reporting more useful.
See where your site sits
We’ve built an explorer on top of all this: a map of every piece, an assistant that you can ask questions in plain English (or other language), and graphs that show where any group of areas sits. It isn’t public yet, but we’re very happy to show it to you.
If you’d like to see how your rehab compares with similar areas across the state, get in touch and we’ll walk you through it. Bring your hardest “compared to what?” question.