With the recent introduction to the market of the Mavic 3 Enterprise drones by DJI, we have seen more users uploading thermal data from the Mavic 3 Thermal drone to GeoNadir. Thermal data is not the easiest data to capture from a drone mapping mission, and this case study gives some insights into how to achieve the best results.
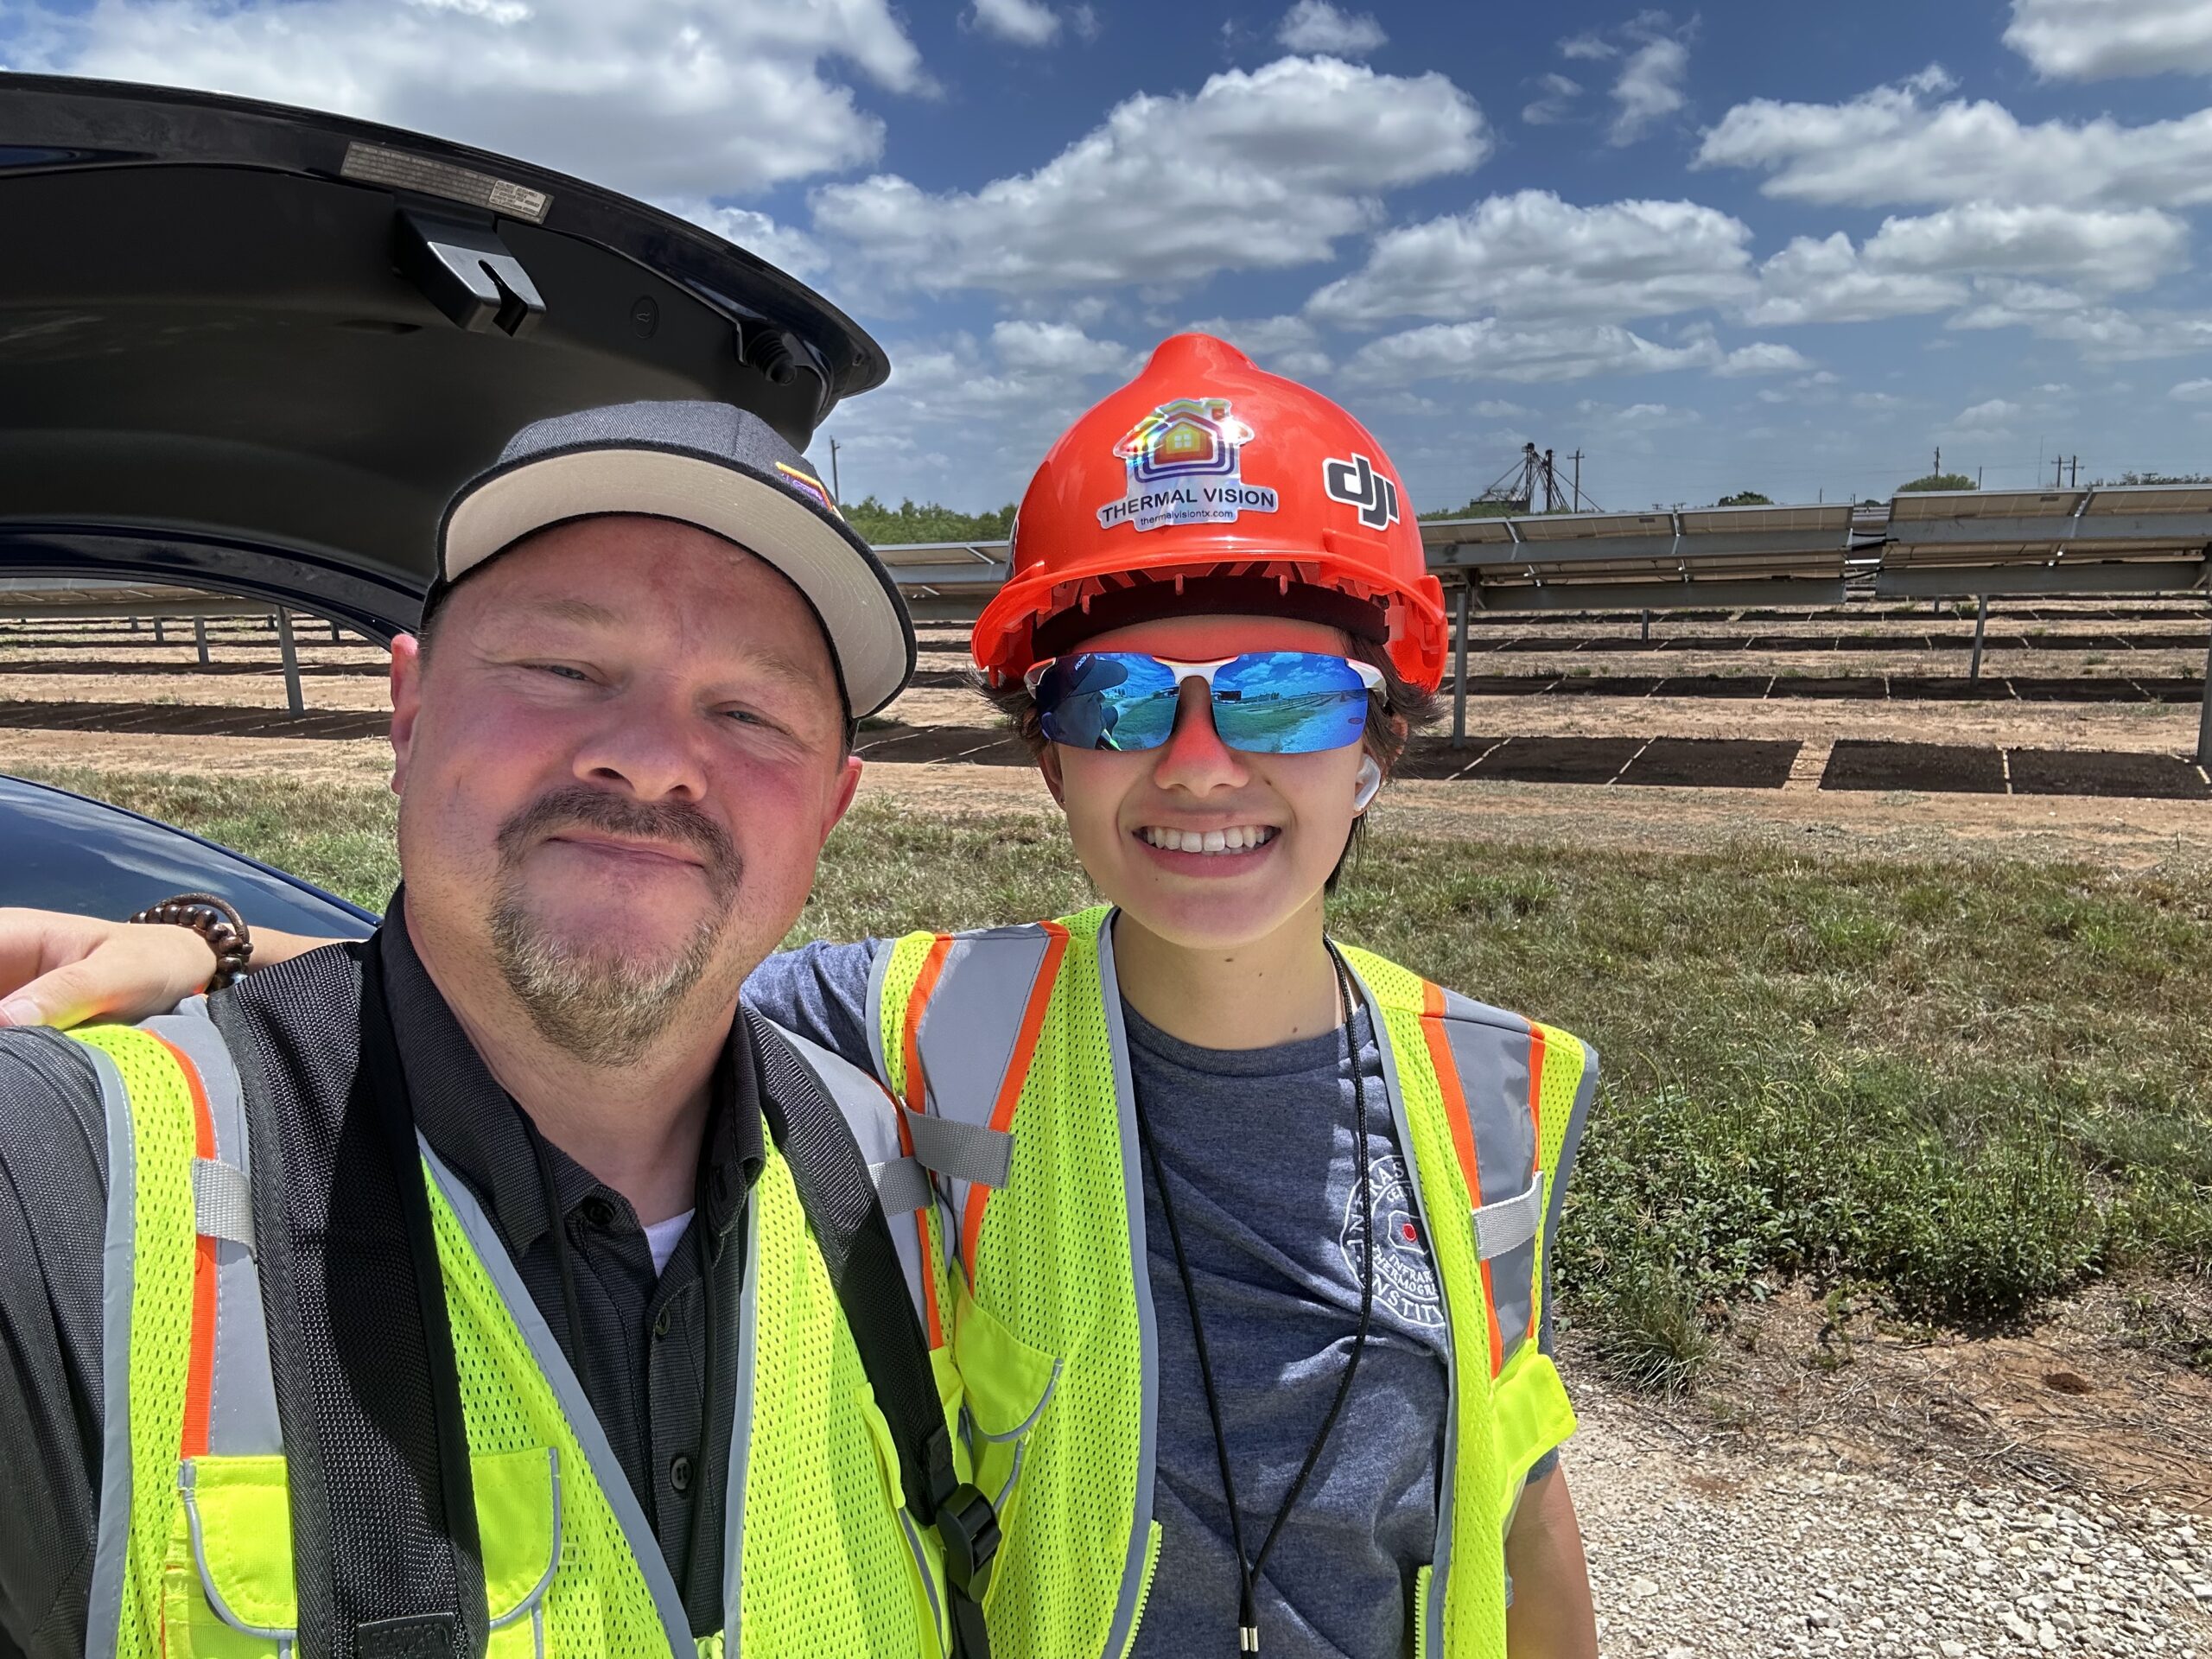
We have worked with David Gierke from Thermal Vision, Texas on this blog. David is a qualified thermographer, and brings his decades of experience in critical infrastructure to his clients.

Contents
Introduction to thermography
Thermography is a technique that uses infrared imaging to detect temperature variations on surfaces. It is especially useful in identifying hidden issues like heat loss, water leaks, or insulation problems.
Thermographers are professionals who are trained to interpret thermal images and pinpoint potential issues by reading the temperature variations in the images. In the context of roofing, they help identify areas of damage, moisture intrusion, or energy inefficiency that might not be visible to the naked eye.
Traditional thermography, once reliant on handheld infrared cameras and manual inspections, has evolved significantly with advancements in technology. Historically, thermographers had to physically access rooftops, scaffolding, or other hard-to-reach areas, often facing risks in challenging environments like steep or tall buildings. Drones equipped with thermal cameras have revolutionized this process, providing a faster, safer, and more efficient means to conduct inspections.
Thermal Vision L.L.C
Thermal Vision is located in Austin, Texas, USA and provides thermographic assessments of buildings. They are using drones in particular to conduct roof inspections to analyze the condition of the roof, look for water infiltration, insulation issues, and other deficiencies.
The problem Thermal Vision solves
Drones reduce the need for inspectors to climb onto roofs, reducing safety risks while covering large areas in a fraction of the time. Using thermal drone mapping, we can capture high-resolution thermal images from multiple angles, even reaching difficult areas that would be impossible or dangerous for human access.
Thermal drone mapping data help to find undetected leaks or water damage which can lead to biological growths such as mold, structural issues, or energy inefficiency costing building owners and insurance companies thousands in fixing the issue if not caught early.
David and his team are helping their customers identify these issues when they are small and be easily rectified. This reduces the cost of the works, and also ensures that the business operating in these buildings or homeowners don’t suffer the costs of having to relocate due to a catastrophic event.
Thermal Vision workflow
The best time to capture thermal data of roofs is typically during the early morning or late evening. These periods offer optimal conditions for accurate thermal readings for several reasons:
- Cooler temperatures: After sunset or before sunrise, the roof has cooled down from daytime heat, allowing for clearer detection of anomalies like insulation defects, leaks, or moisture. If the sun is shining directly on the roof, it can mask these issues by warming up the entire surface.
- High thermal contrast: During the night, heat retained by leaks or insulation failures stands out against cooler areas due to water’s higher thermal capacitance, thus allowing it a higher thermal load as compared to dry areas. This makes it easier to detect temperature differences in thermal images.
- Avoiding solar gain: Midday inspections are often less effective because the sun’s heat can saturate the roof surface, making it difficult to distinguish between actual issues and normal solar heating.
Equipment and settings
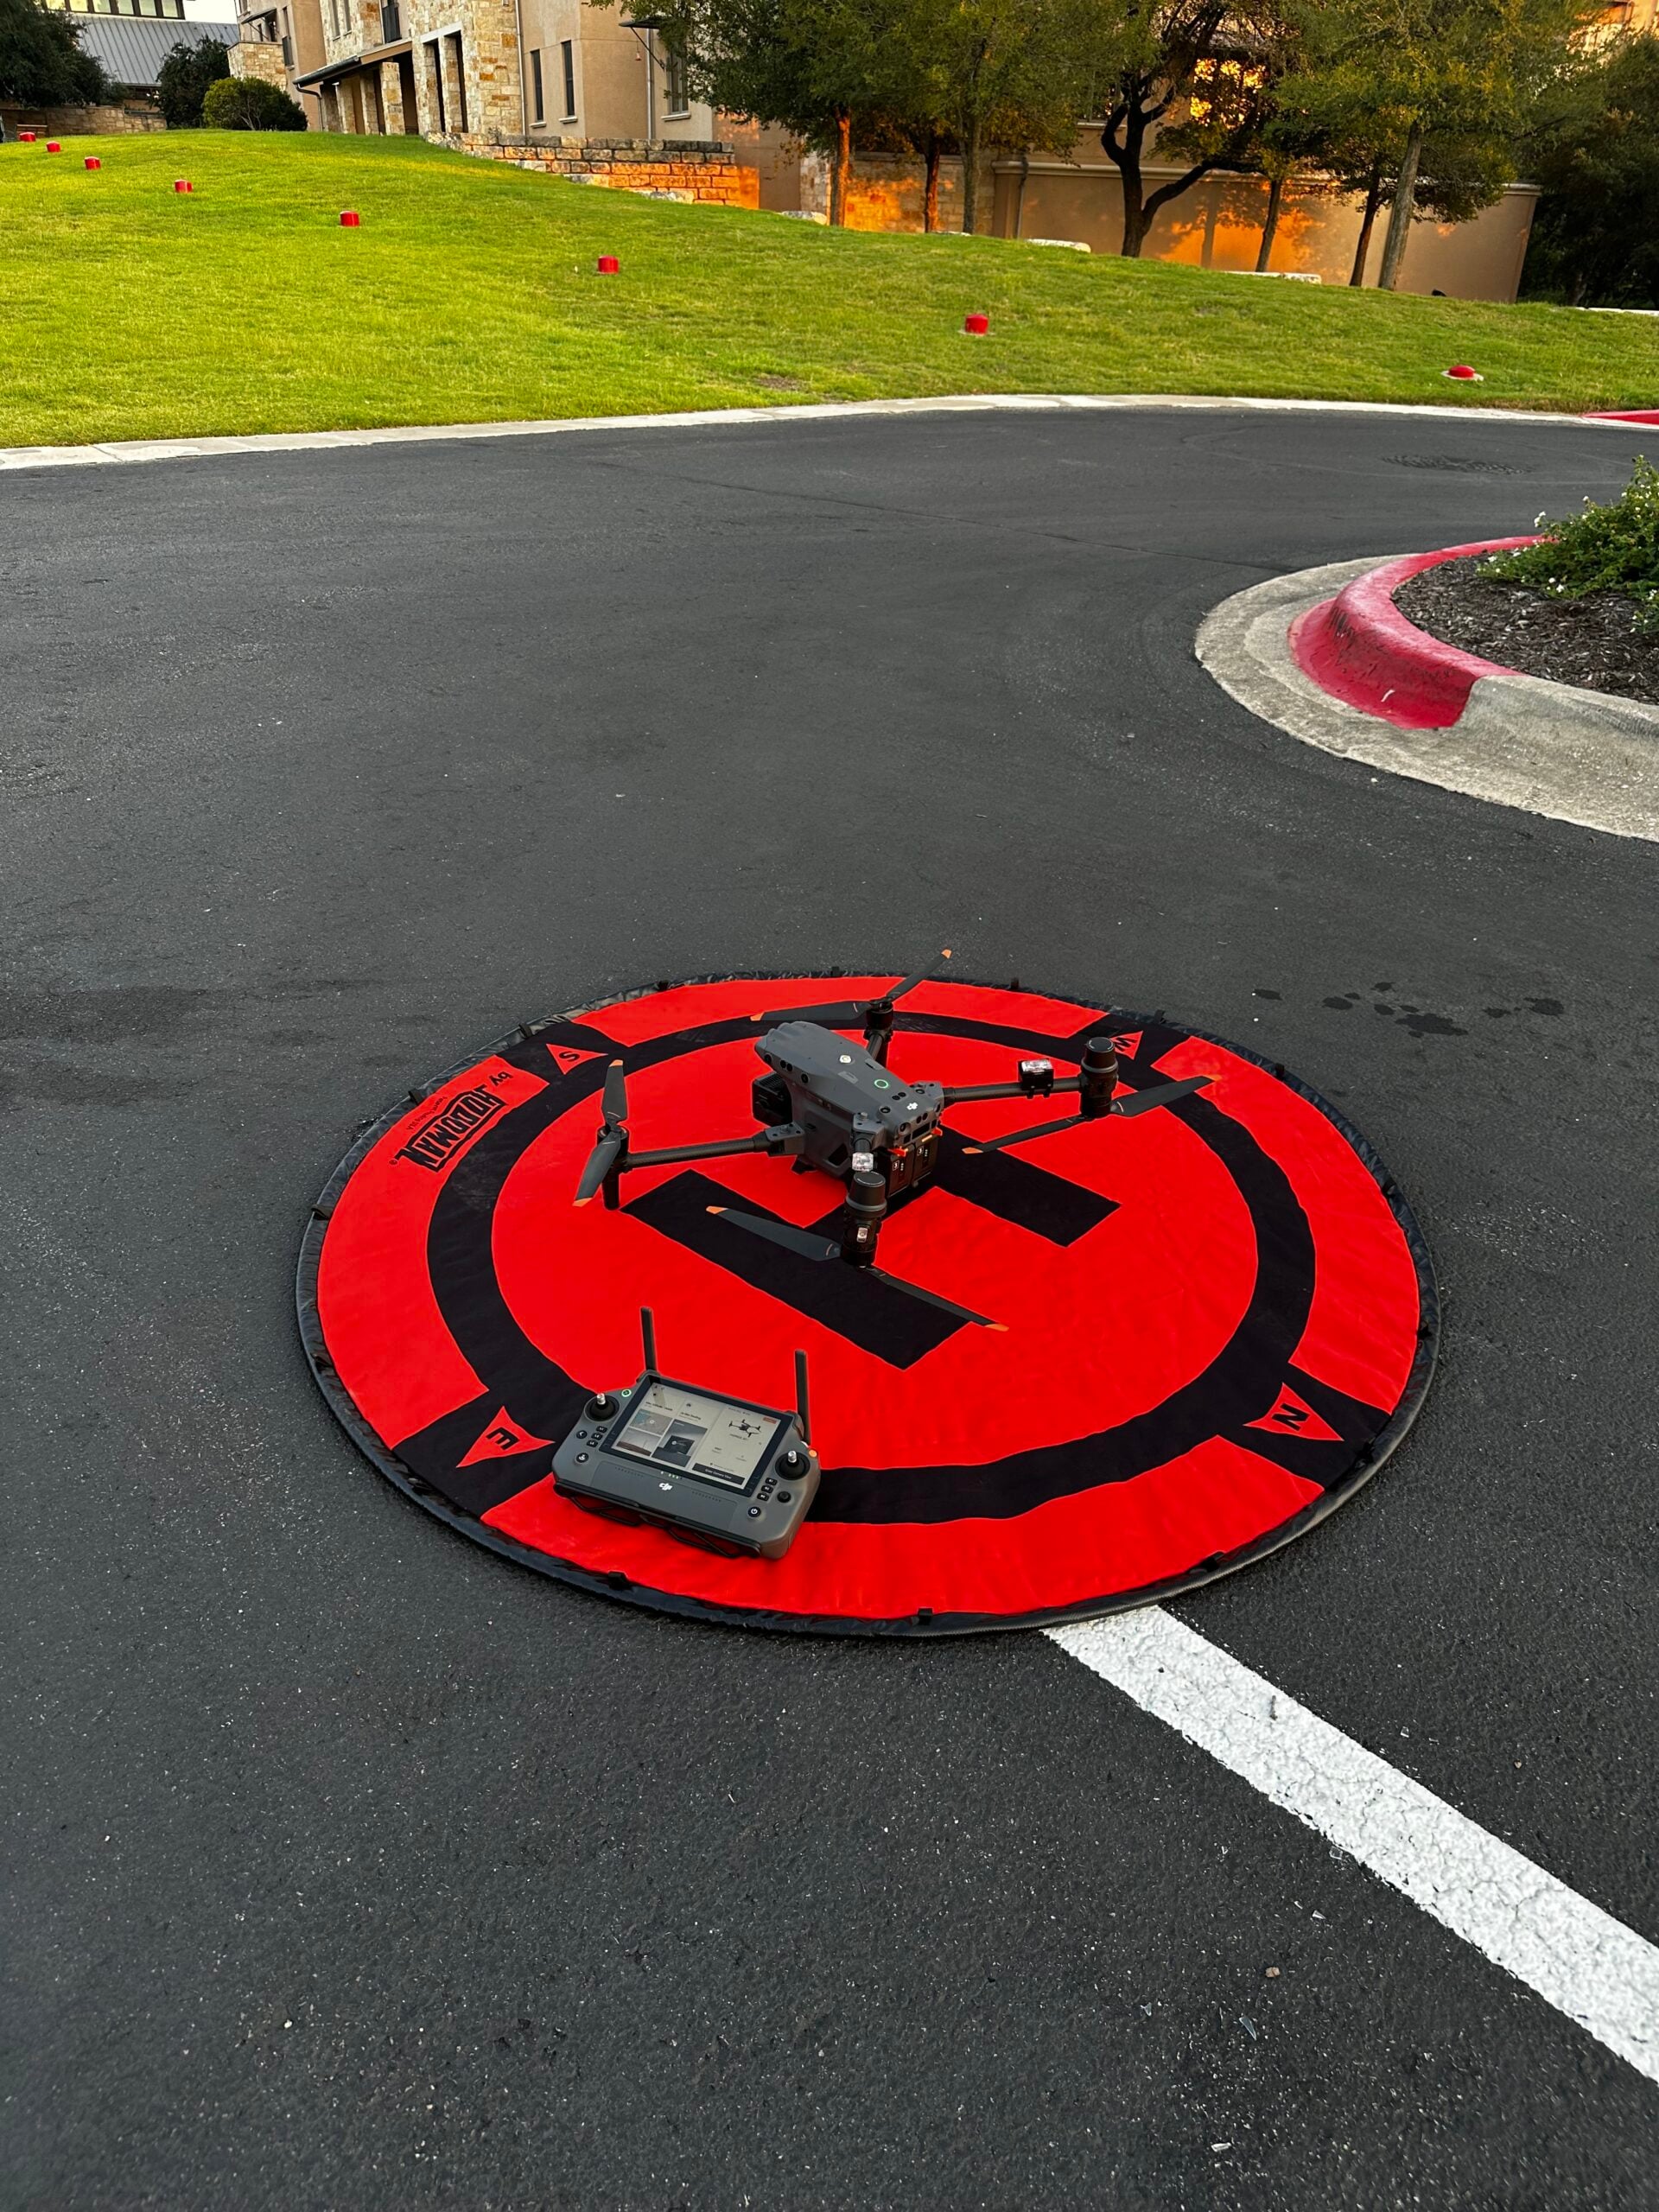
David uses the DJI Matrice 30 Thermal drone for his drone mapping missions, planning the mission on the DJI Smart Controller.
The settings he uses are:
- 83% overlap and 83% sidelap
- Flies at a height around 23 m / 75ft above the roof
- Reduces the speed of the drone to 1.7 miles per hour or (2.8kph). This is slower than the factory setting for mapping missions and ensures that the thermal data is clear and focussed.
- The DJI Iron Red Palette colour ramp.
- An offset of the approx roof height to allow for the correct GSD to be calculated.
- A wide open temperature range usually, but adjusted if needed.
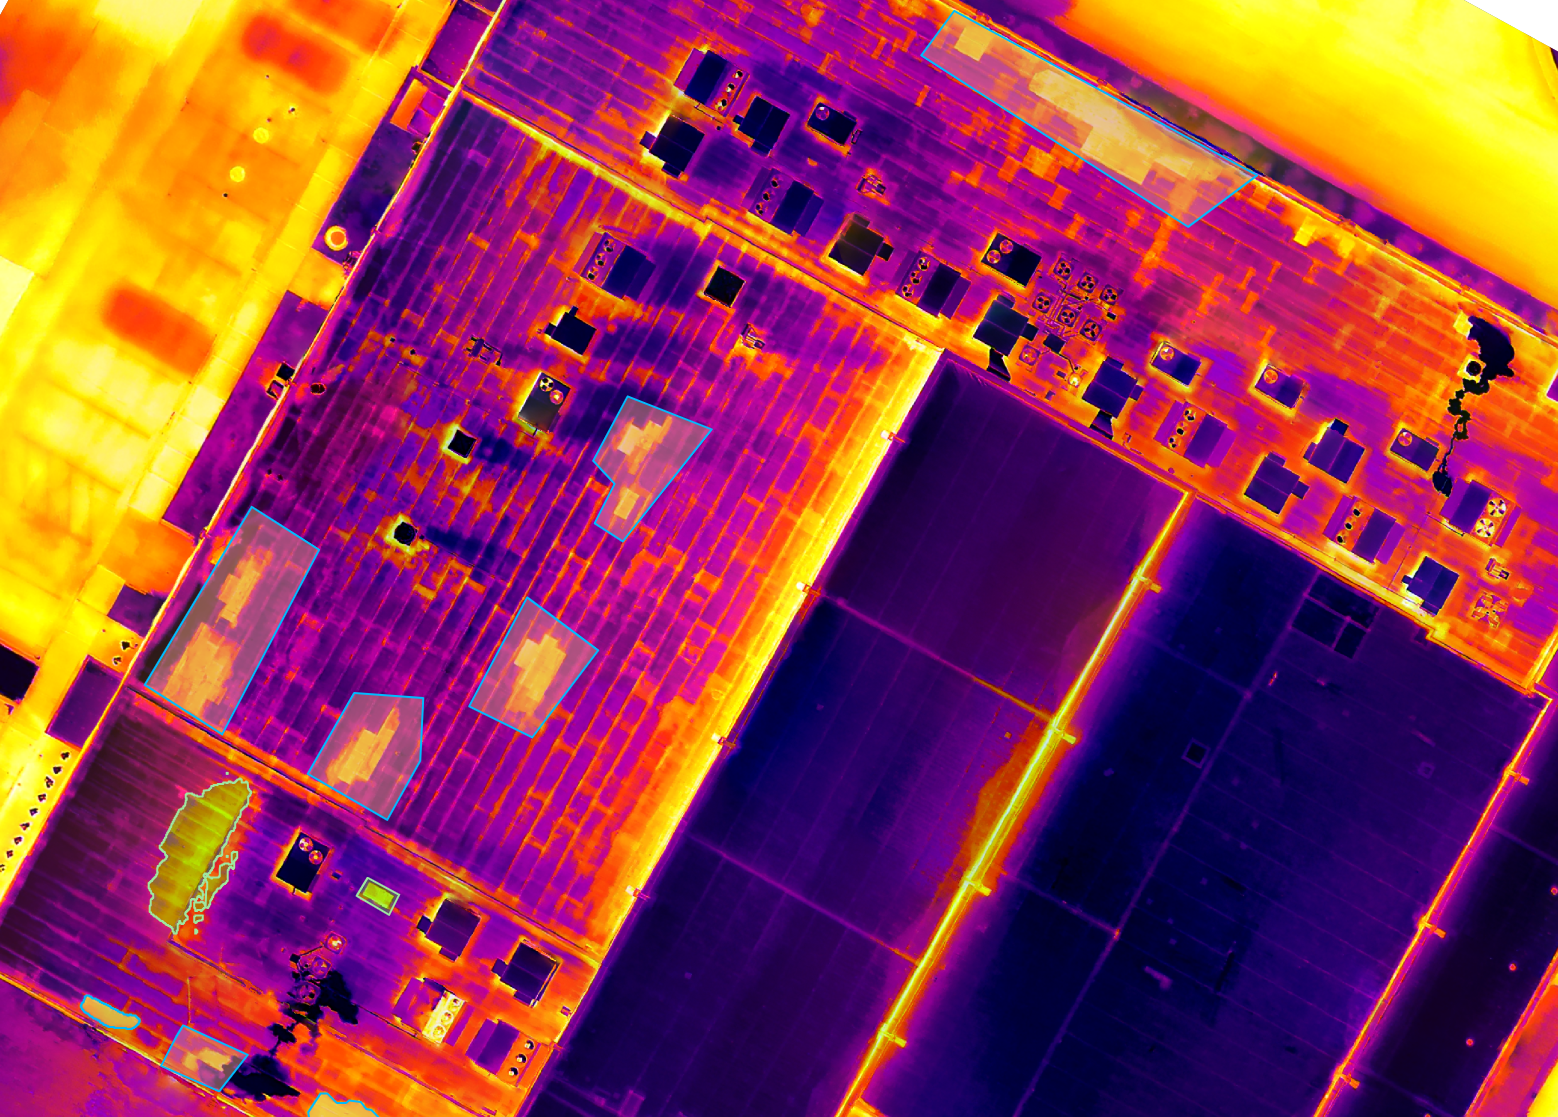
The results
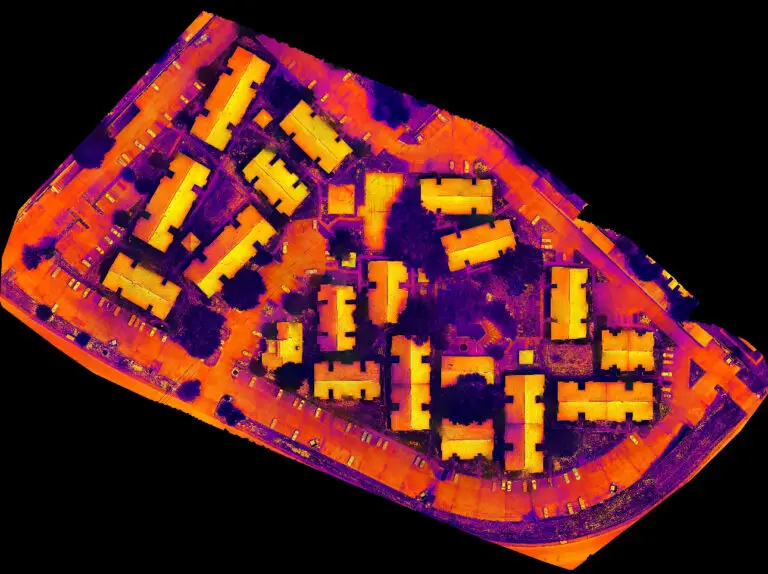
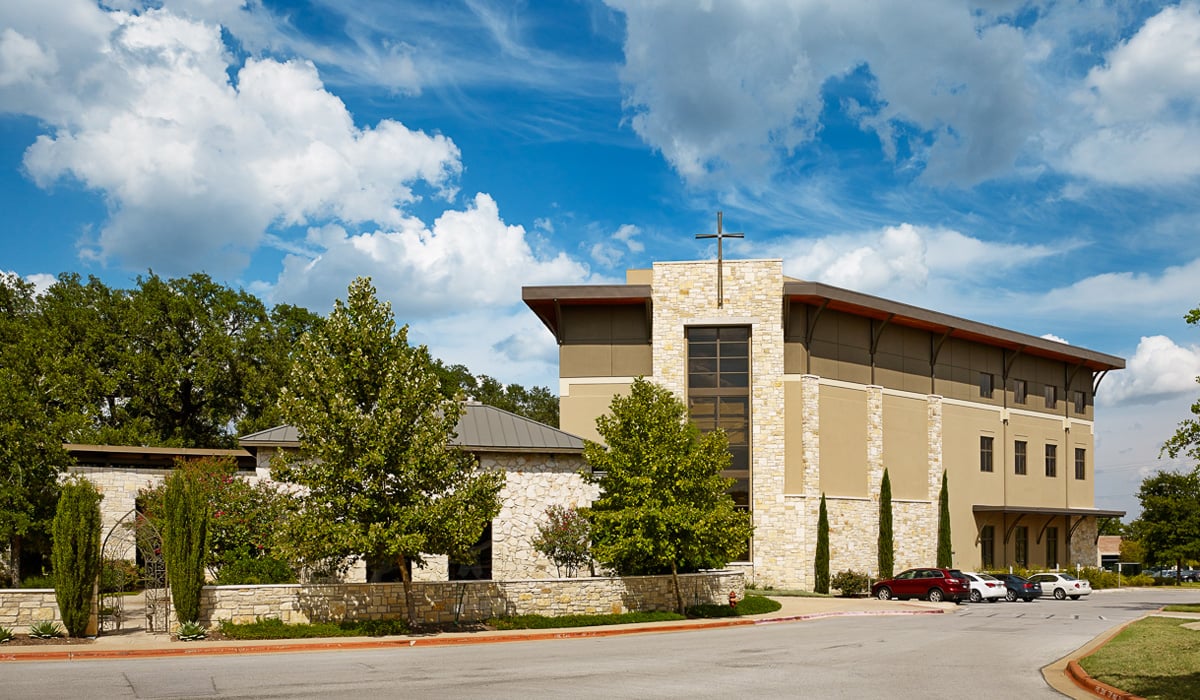
David has been able to deliver amazing results to his clients. One client in particular is Austin Oaks Church.
This dataset with some analysis can be viewed in this project here.
The thermal dataset is sitting on top of the RGB orthomosaic, and you can change the transparency of the thermal orthomosaic (or turn this layer off) to see the RGB orthomosaic underneath.
Thermal drone mapping project overview
David explains a bit about why the Austin Oaks Church asked him to come out and do the work…
The client was seeking bids for a new roof and approached several roofing companies for proposals. One of the contractors went above and beyond by commissioning a Thermographic Roof Scan from Thermal Vision, LLC. Our certified F.A.A. drone pilot conducted all mission planning and flight operations with careful attention to detail, ensuring that the scan was performed safely during nighttime conditions. Safety protocols included the use of a Visual Observer, highly reflective vests, and on-site lighting.
After collecting the thermal data, one of the certified thermographers meticulously tuned the images and conducted a detailed data analysis. They then generated a comprehensive thermographic report, providing valuable insights into the roof’s condition.
In addition, the client requested 3D models and orthomosaic maps, which were integrated into the final deliverables. All of the data were provided to the roofing company to support their bid and offer the client a more informed decision-making process.


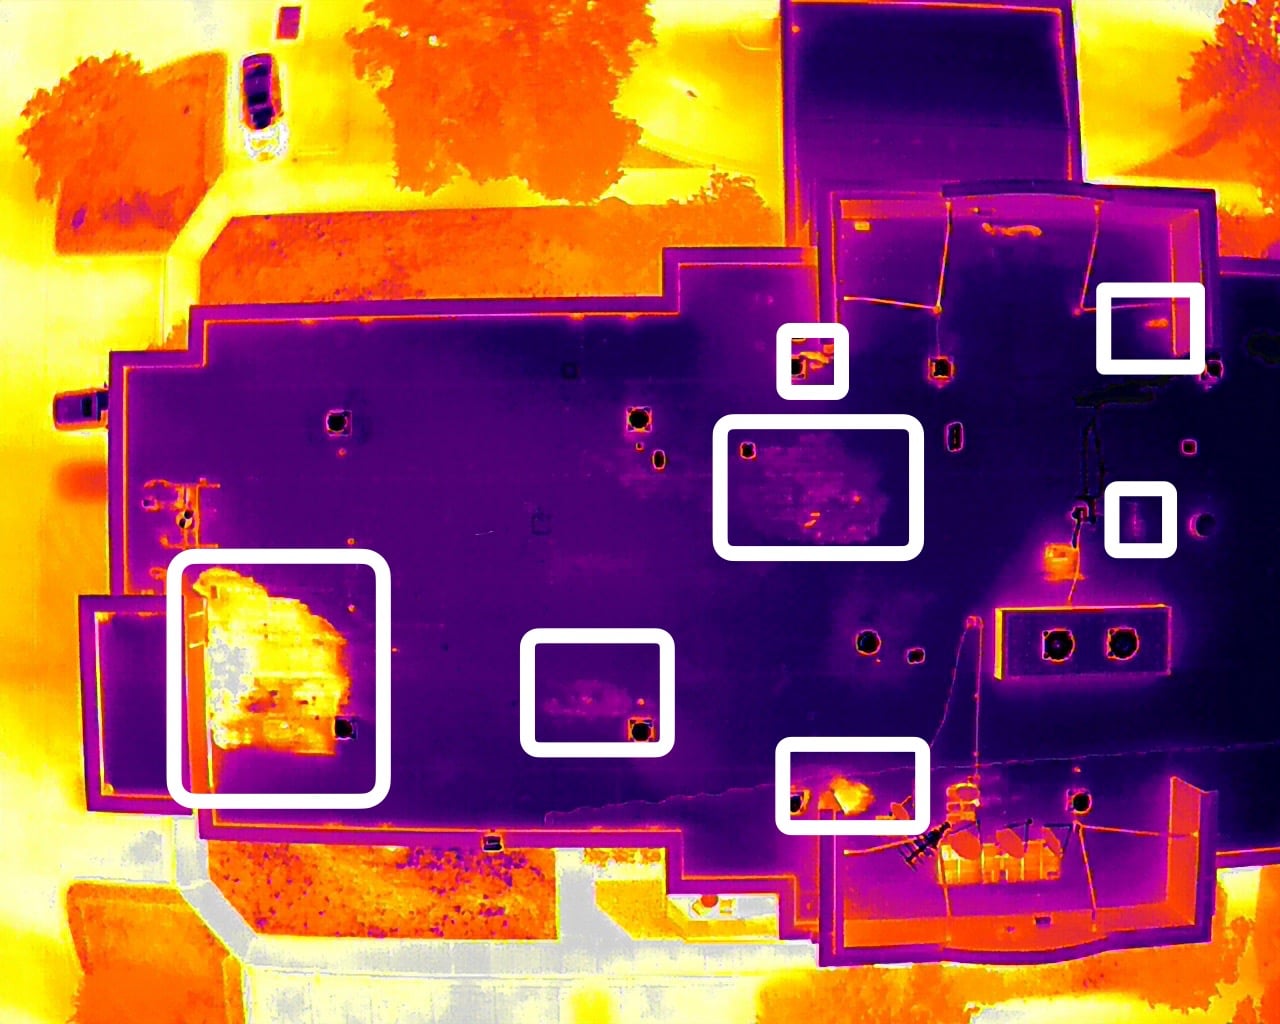
David explains the issues he found by using the processed drone data…
“Our experienced team identified several significant thermal anomalies, including areas of suspected moisture intrusion. Detecting these issues during the bidding process is crucial, as it ensures a more accurate materials list and a well-defined scope of work before the project begins. This proactive approach helps to minimize the risk of change orders, scope creep, and unexpected additional costs—ultimately delivering a smoother and more predictable project experience for both the contractor and the customer.”
David explains how this process saved the Austin Oaks Church money…
This process saved Austin Oaks Church both time and money by providing a highly accurate assessment of their roof’s condition. By conducting a thorough thermal scan, the roofing company was able to deliver a precise and detailed bid, ensuring the scope of work and materials were accurately projected. In contrast, the other roofing companies, which did not incorporate this level of data collection, were unable to offer a comprehensive analysis of the roof’s current condition, potentially leading to unforeseen costs and project delays.


David explains how GeoNadir is helping him deliver better results to his clients …
GeoNadir has become an essential tool in the way we service our clients. It enables us to provide a seamless, user-friendly experience while also telling a compelling story with thermal data. Many of our clients are unfamiliar with thermal imaging, and GeoNadir allows us to present both a comprehensive overview of their property and a deeper dive into specific areas through detailed maps. This clarity not only enhances our communication with clients but also empowers them to make more informed decisions
Ideal settings for thermal drone mapping
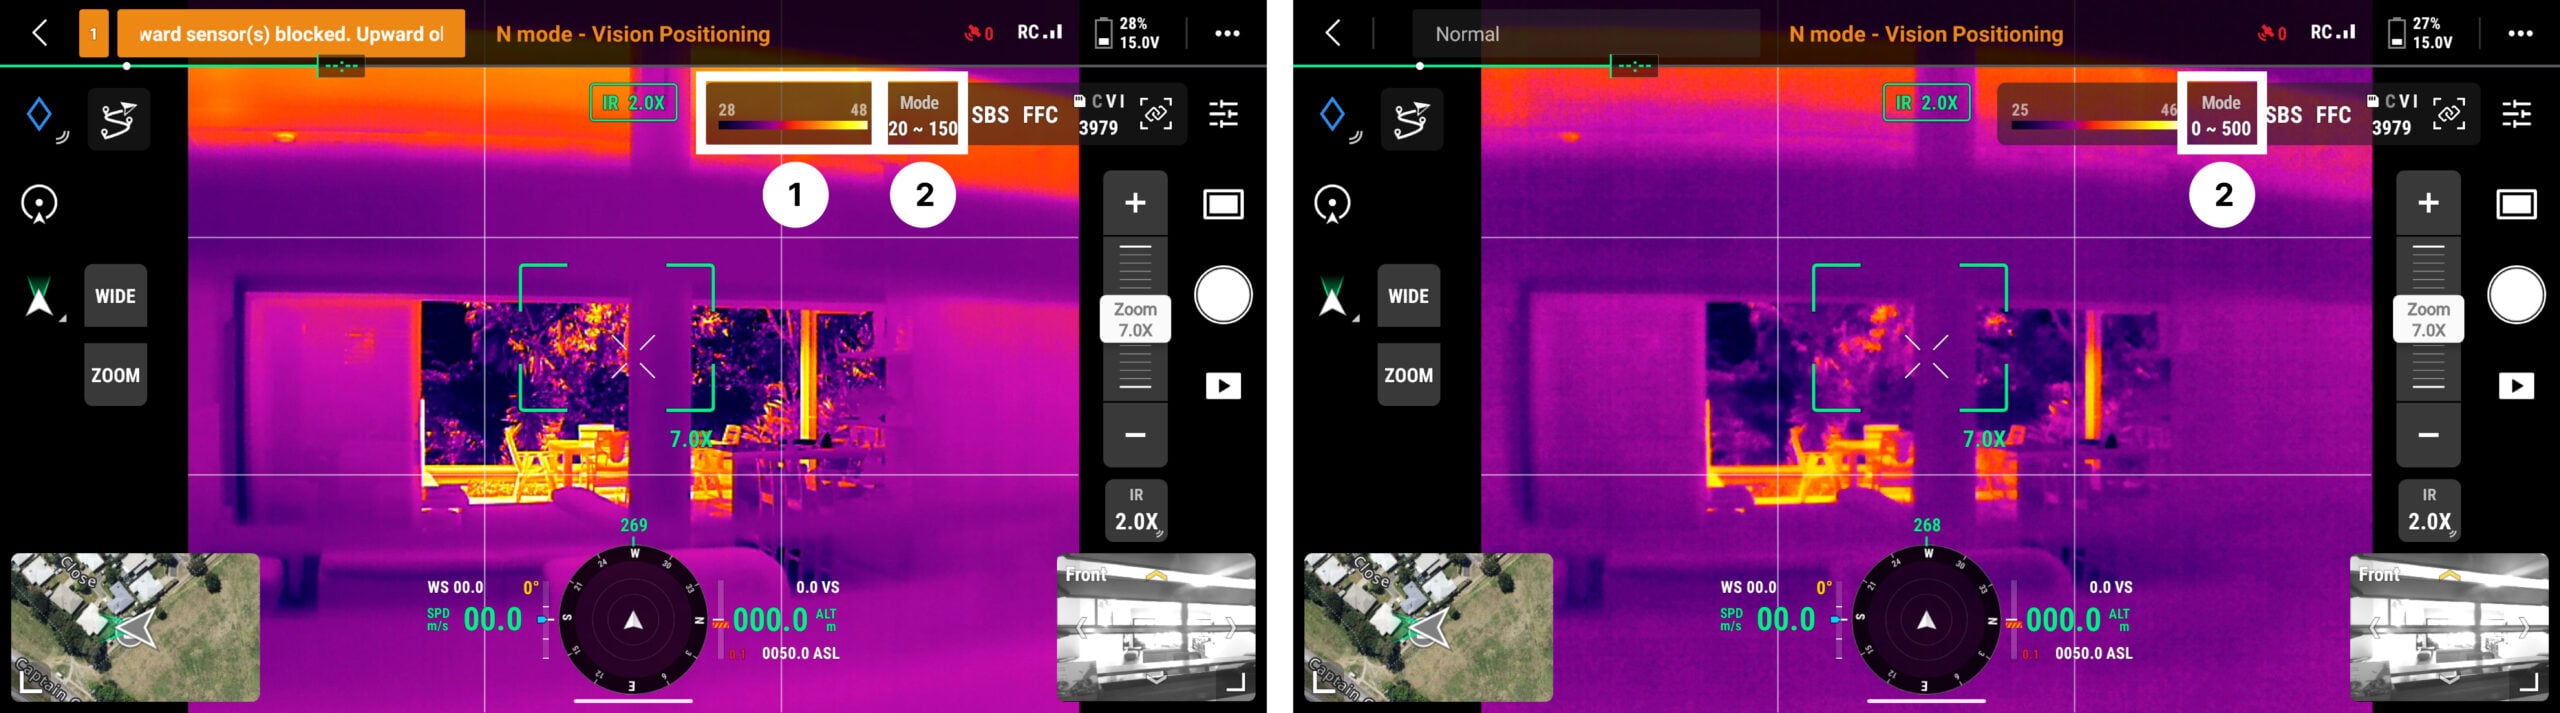
1. Firstly, you will need to choose your colour ramp. You need to do this before you go into the drone mapping mission planning interface. In the images below, we’ve selected ‘iron red’. ‘White hot’ is also good. To make your choice, tap on the colour ramp at the top, outlined by the white box. Do NOT choose the one that is grey scale with some red tints.
2. Next, toggle between the two ‘modes’ (next to the colour ramp). One setting is 20-150, the other is 0-500. the former returns a sharper image, the latter is good if you have a wide range of temperatures. We like the 20-150 setting best.
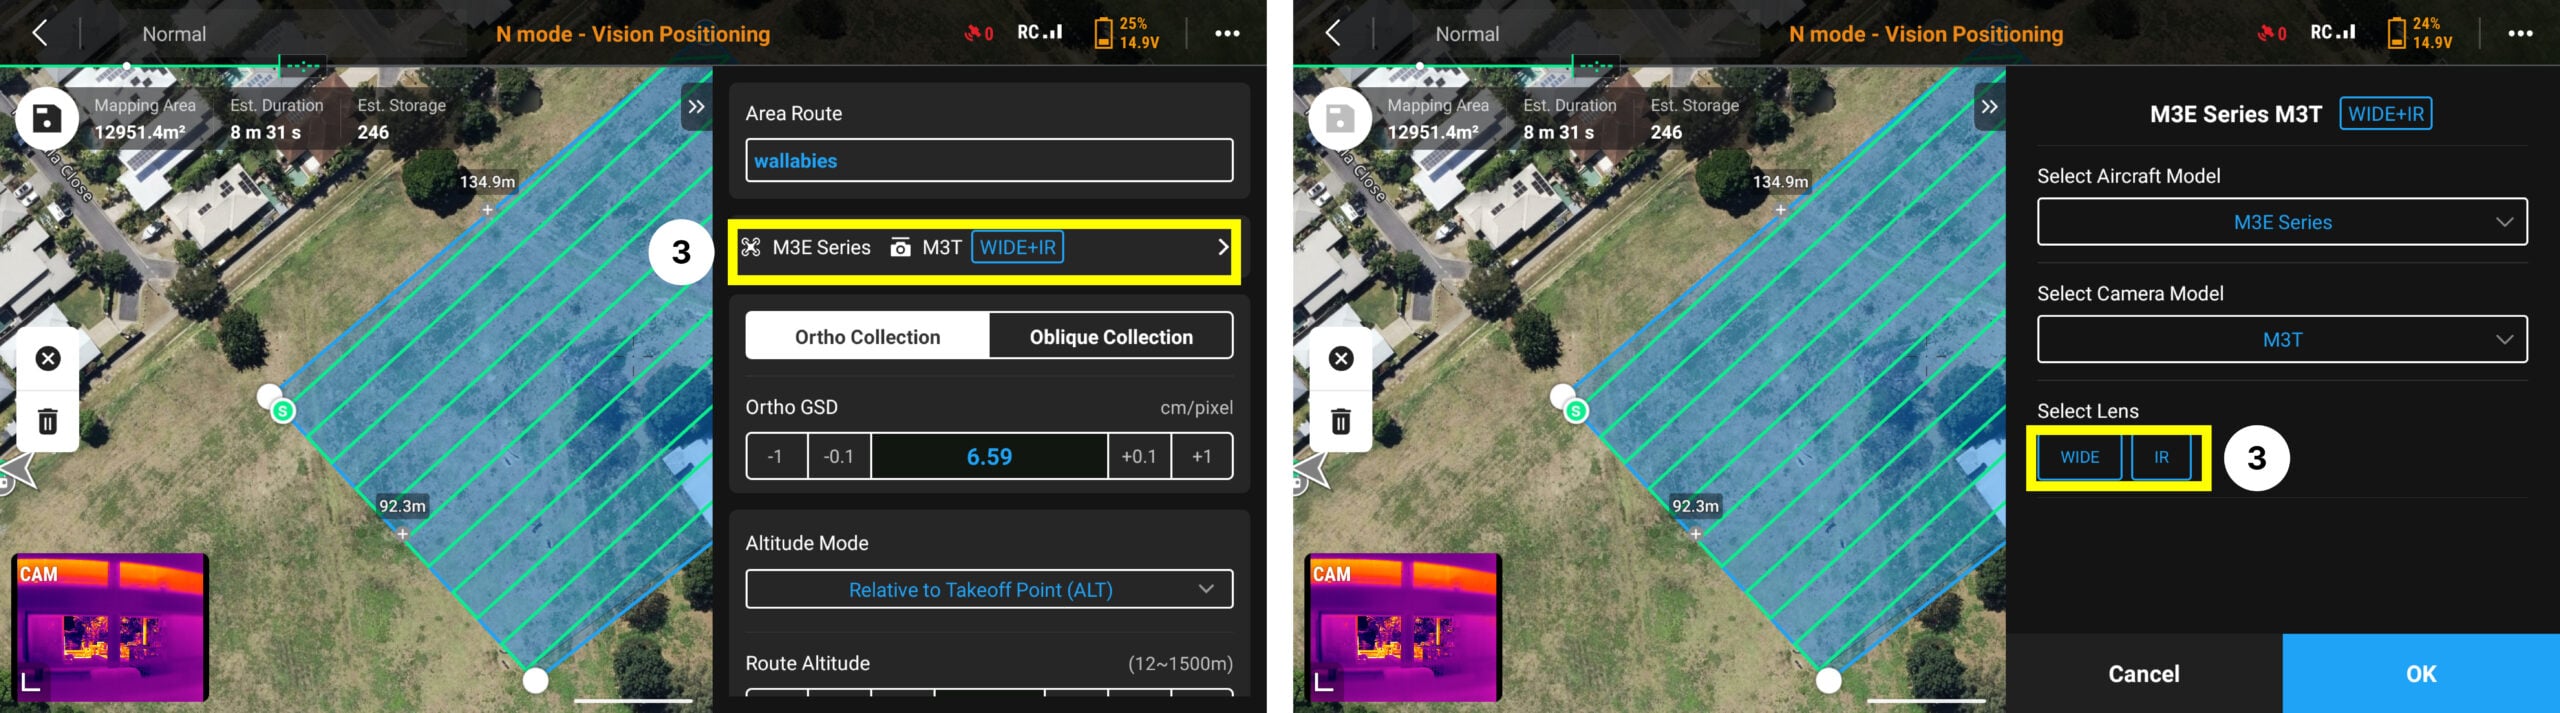
3. If you are drone mapping at night time or in low light conditions, you can turn off the ‘wide’ (RGB) sensor. Otherwise images will be underexposed or out of focus and not usable anyway. For best results, capture thermal data pre-dawn or after dusk. If you are not licensed to fly at night, capture as close to dusk or dawn as possible. You don’t want to have solar reflection in your data.
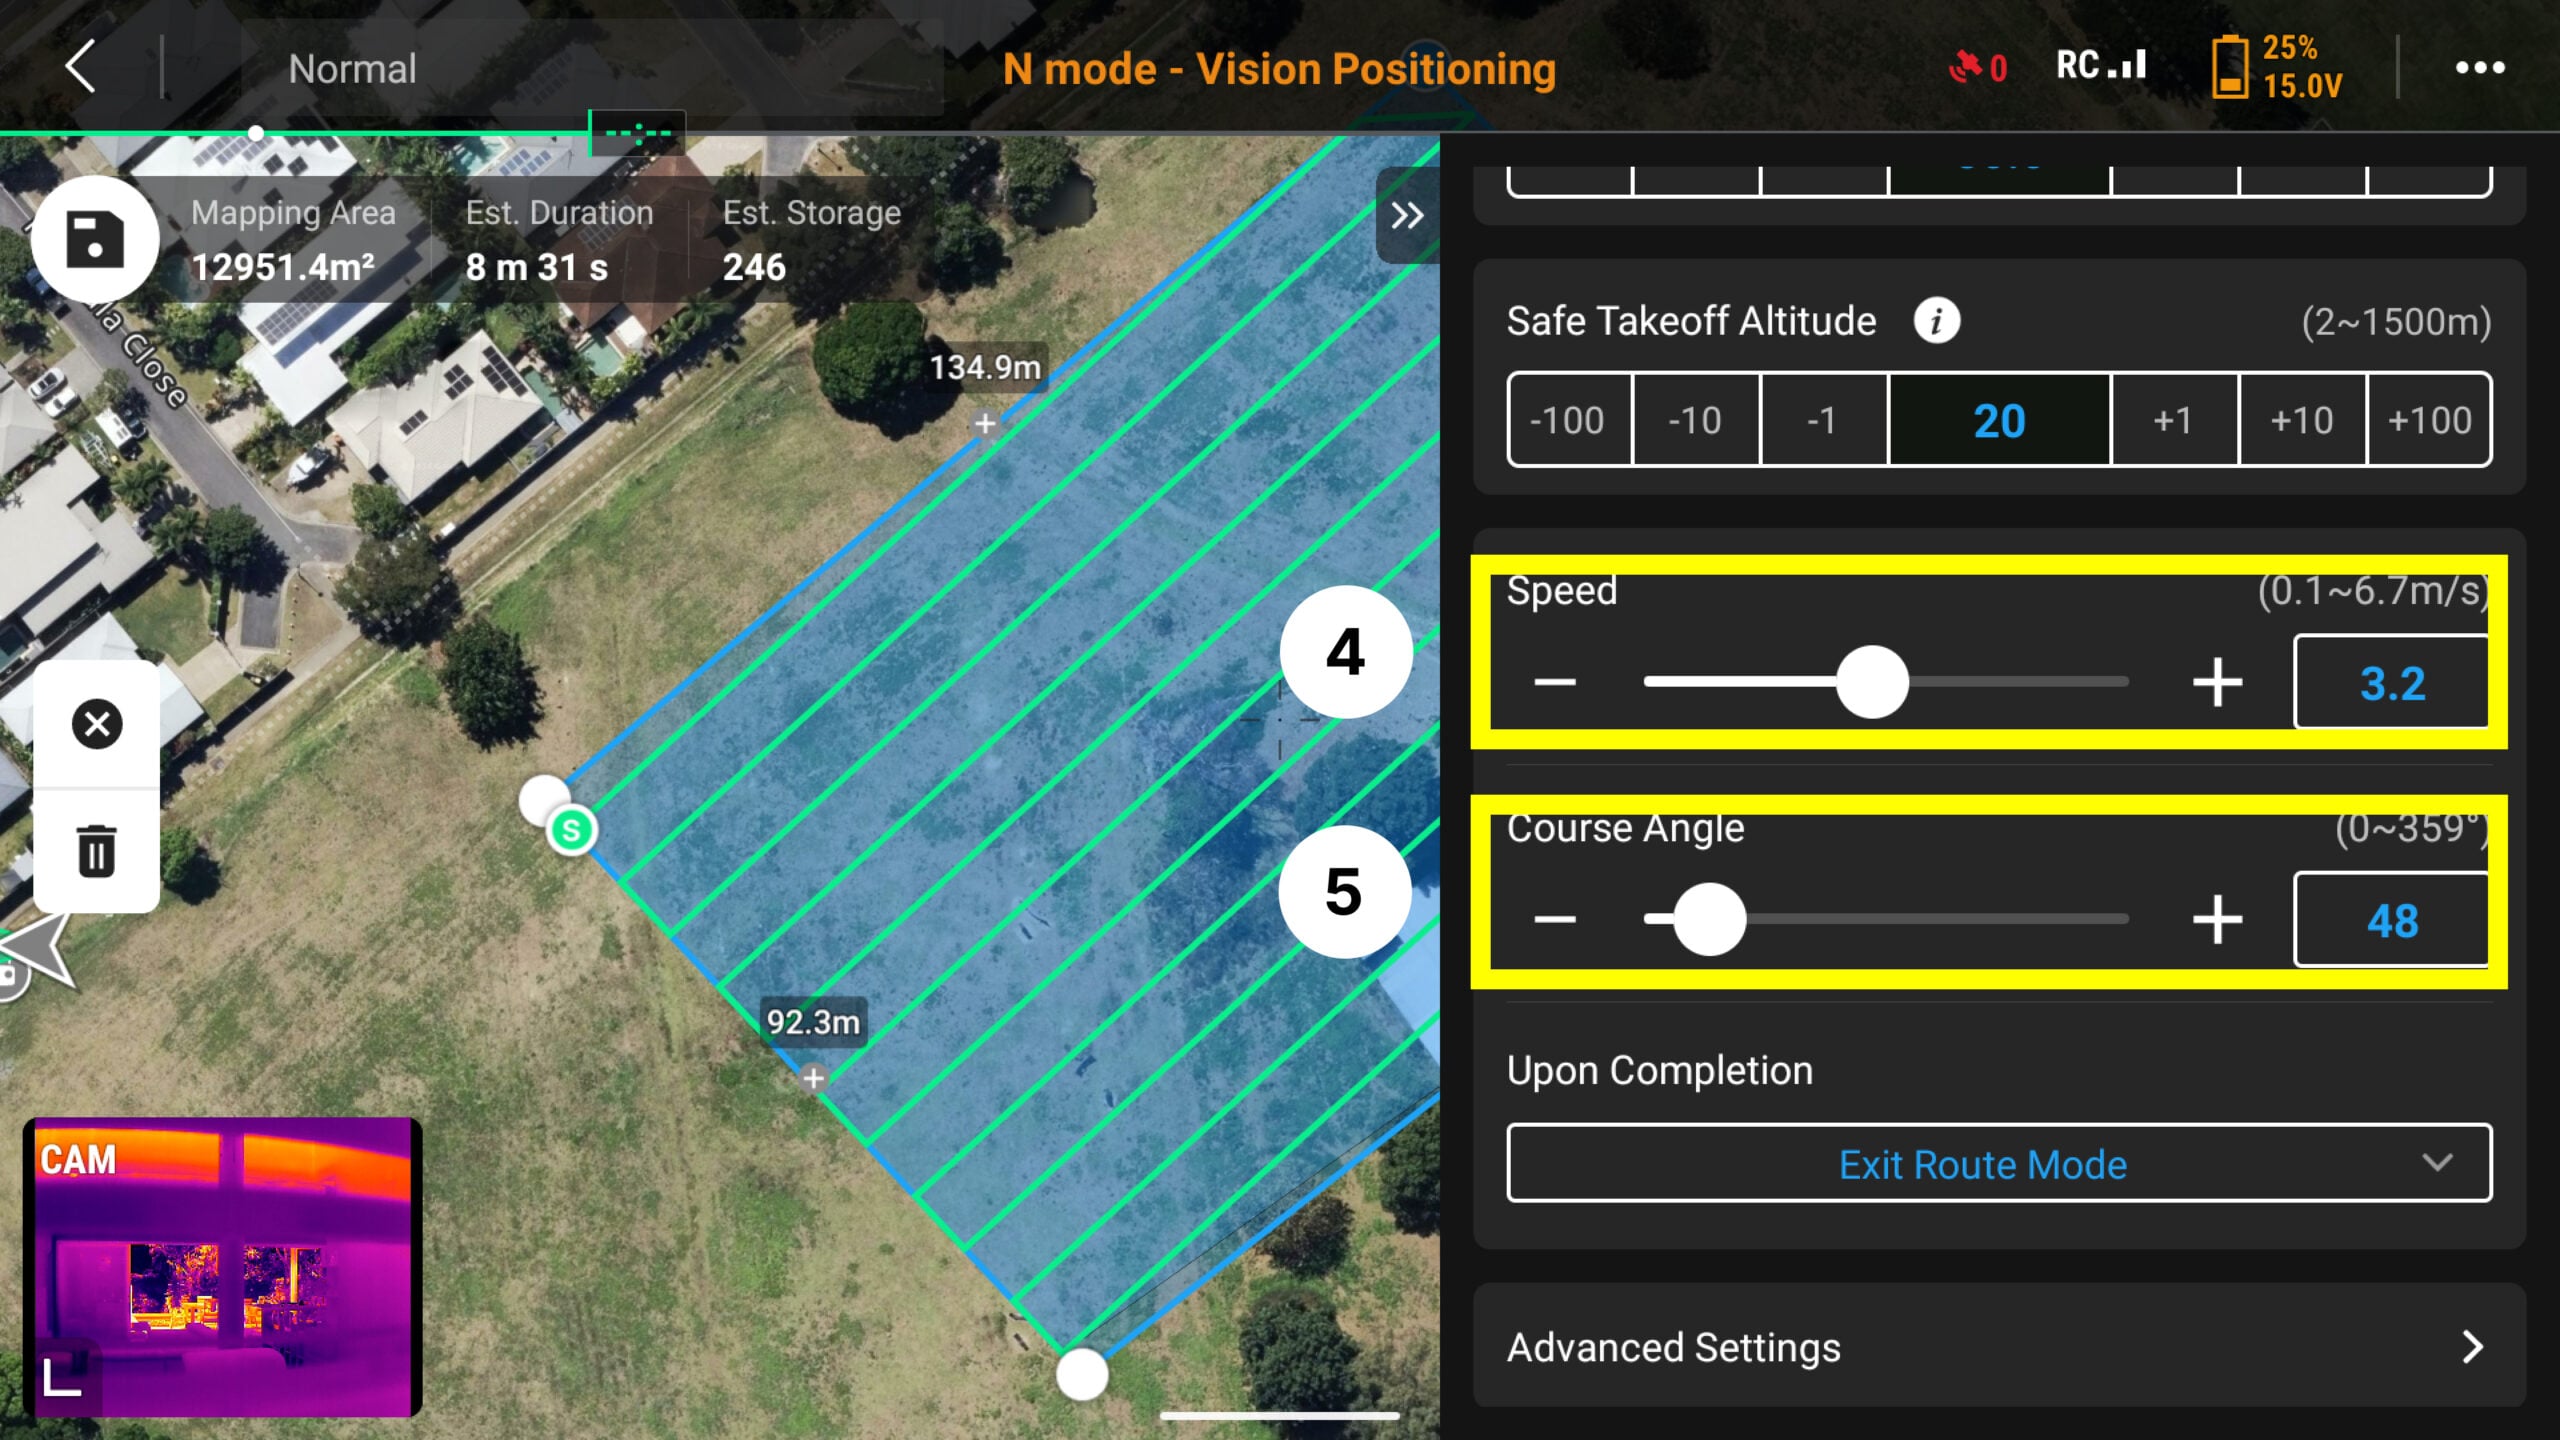
4. Make sure that you decrease your speed. In this example I’ve used 3.2m/s at an altitude of 50m and got a good result. If you are flying lower for more detail, reduce the speed further.
5. Take note of the course angle, ready for step 7.
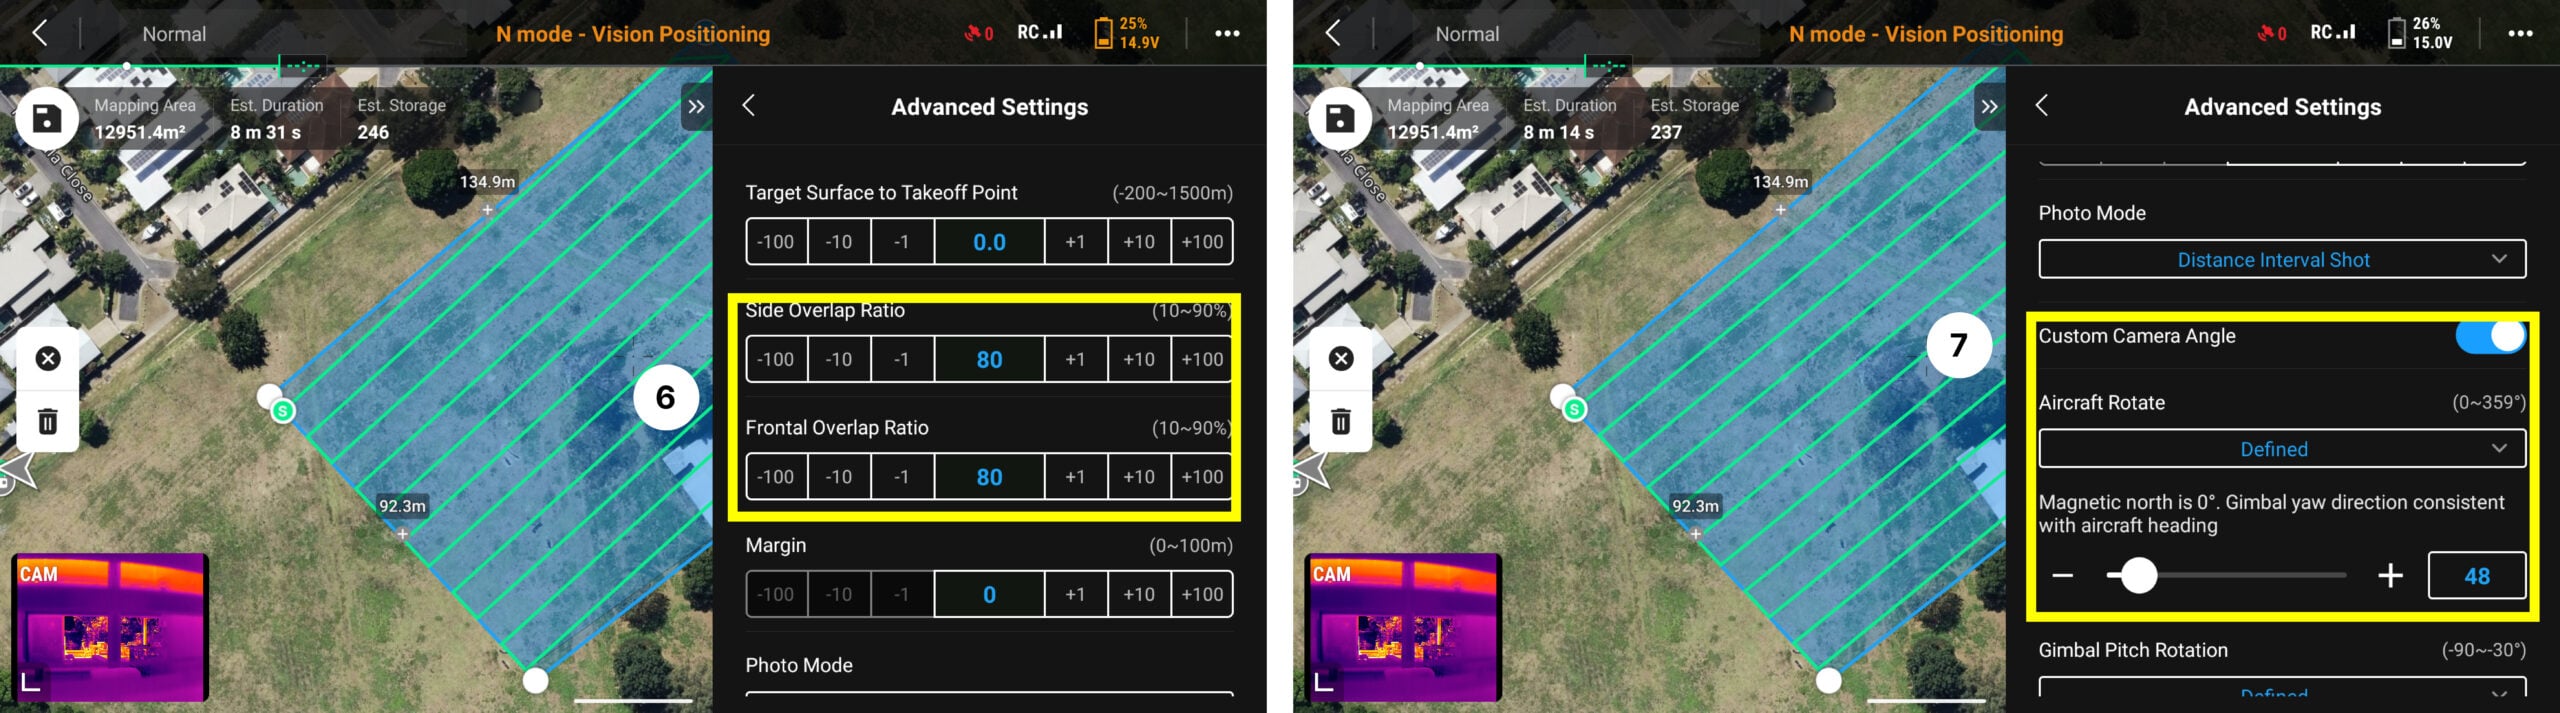
6. Confirm that your overlap and sidelap are set to a minimum of 80%. Note that David used 83%.
7. Toggle for the custom camera angle, change the aircraft rotate to ‘defined’ and set the angle to be the same as the course angle (from step 5). This will stop the drone from turning around at the end of each flight line so all images are facing the same direction.
Processing your thermal drone data
Once you’ve captured thermal drone mapping data, simply upload into your GeoNadir project. We like to just drag and drop the images in! If you’ve captured the RGB data as well, upload those data as a separate datasets.
We’ll take care of the rest to create your orthomosaic. Once it’s done, we’ll send you an email to let you know.
At the moment we are not processing radiometric thermal data. This means that the pixel values in the orthomosaic won’t represent the absolute temperature at that location. But the relative temperature across the area should look good.
As always, please reach out to us if you have questions!
Photo and project credits to David and Emiliana Gierke from Thermal Vision, Texas.
If you would like your business and project profiled, then reach out to us at hello@geonadir.com
Ready for a more organised drone mapping data analysis workflow?
Upload a few datasets today. It’s free to get started.