Integrating drone technology with cutting-edge software has revolutionized the way industries collect, process, and analyze geospatial data. One of the most versatile tools in this field is the DJI Mavic 3 Multispectral (Mavic 3M), a drone designed for precision agriculture, environmental monitoring, and land management. DJI also provides its own data processing software, DJI Terra, designed to work seamlessly with the Mavic 3M for capturing and processing multispectral mapping data. I recently had the chance to test out a demo unit, and here’s my honest review of both the drone and the app.
What does the multispectral sensor do?
First of all, let’s recap a little about the concept of multispectral sensor. These sensors measure light across different ‘colours’, including ones we can’t see, like near-infrared (NIR). On a drone, this sensor helps capture detailed information about the land or plants below. For example, it can help us detect and identify certain features (e.g. weeds) by measuring how much light they reflect in certain colours. These data are used to calculate things like plant health, soil moisture, or even how much vegetation is growing in an area. It’s especially useful for farming, environmental studies, and land monitoring. In the context of drones like the Mavic 3 Multispectral, the sensor captures data in various bands (green, red, red edge, and near-infrared) to analyze different surfaces.
First Impressions of the Mavic 3 Multispectral drone
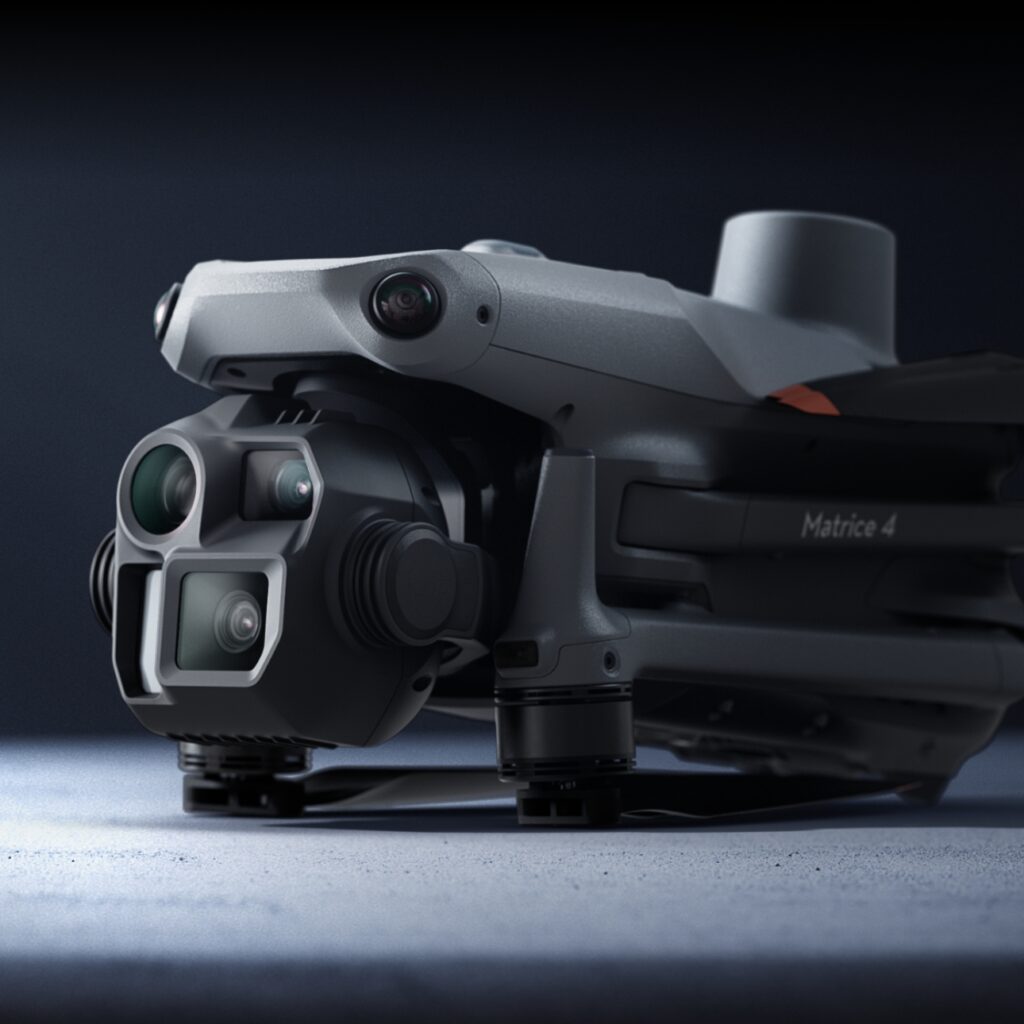
The Mavic 3 Multispectral makes a strong first impression with its compact and lightweight build, making it easy to transport and handle. Its design features both an RGB and multispectral camera on the front, while the sunlight spectral sensor is positioned on the top rear, though care is needed to keep it clean and avoid smudging it by accident.
The Smart RC controller offers intuitive controls with an integrated screen that performs well even in sunlight, making the drone easy to fly. The DJI Pilot 2 app makes it simple for both single photo captures and more complex mapping missions.

Multispectral mapping with DJI Pilot 2
Mapping with DJI Pilot 2 is intuitive for those familiar with mapping. For those who have previously used the DJI GS Pro mission planning app, it will feel very familiar. Here’s our comprehensive instructions for planning a 2D mapping mission using the Mavic 3 series. One standout feature that sets DJI Pilot 2 apart from other drone mapping apps is the ability to define the drone’s heading during the flight mission, which we love. This feature offers greater control and flexibility, allowing users to optimize flight paths for specific terrains or objectives, enhancing the overall efficiency and precision of the mapping process.


Mission start!
After planning your multispectral mapping mission, starting it is as simple as pressing the play button. However, I didn’t find this so intuitive, and it took me a moment to realize that it was the one to press on my first attempt.

You can start the multispectral mapping mission with the drone on the ground or in mid-air. I like to manually fly the drone up and hover in a safe space away from me first before starting the mission. Once the mission is underway, there are still a few last-minute settings you can adjust. A couple of things I always double-check are the battery level, available SD card space, the signal-loss action (i.e. return to home or continue the mission), and whether the mission is set to save the multispectral, RGB, or both types of photos. It can be quite frustrating to realize halfway through the flight that you’re missing your multispectral data, or even worse, that the drone won’t return in the case of a signal issue.


Multispectral mapping data processing
Once the mapping mission is completed, there are several ways to process the data, especially for multispectral images that are captured in digital numbers (DN). To use these data effectively, you’ll need to convert DN values into reflectance. Digital numbers (DN) are raw sensor data that don’t have any real-world meaning on their own. Reflectance, on the other hand, measures the amount of light bouncing off a surface compared to the light hitting it, which makes it crucial for analyzing material properties like vegetation health or soil moisture. Converting DN to reflectance is essential for turning raw data into meaningful insights.
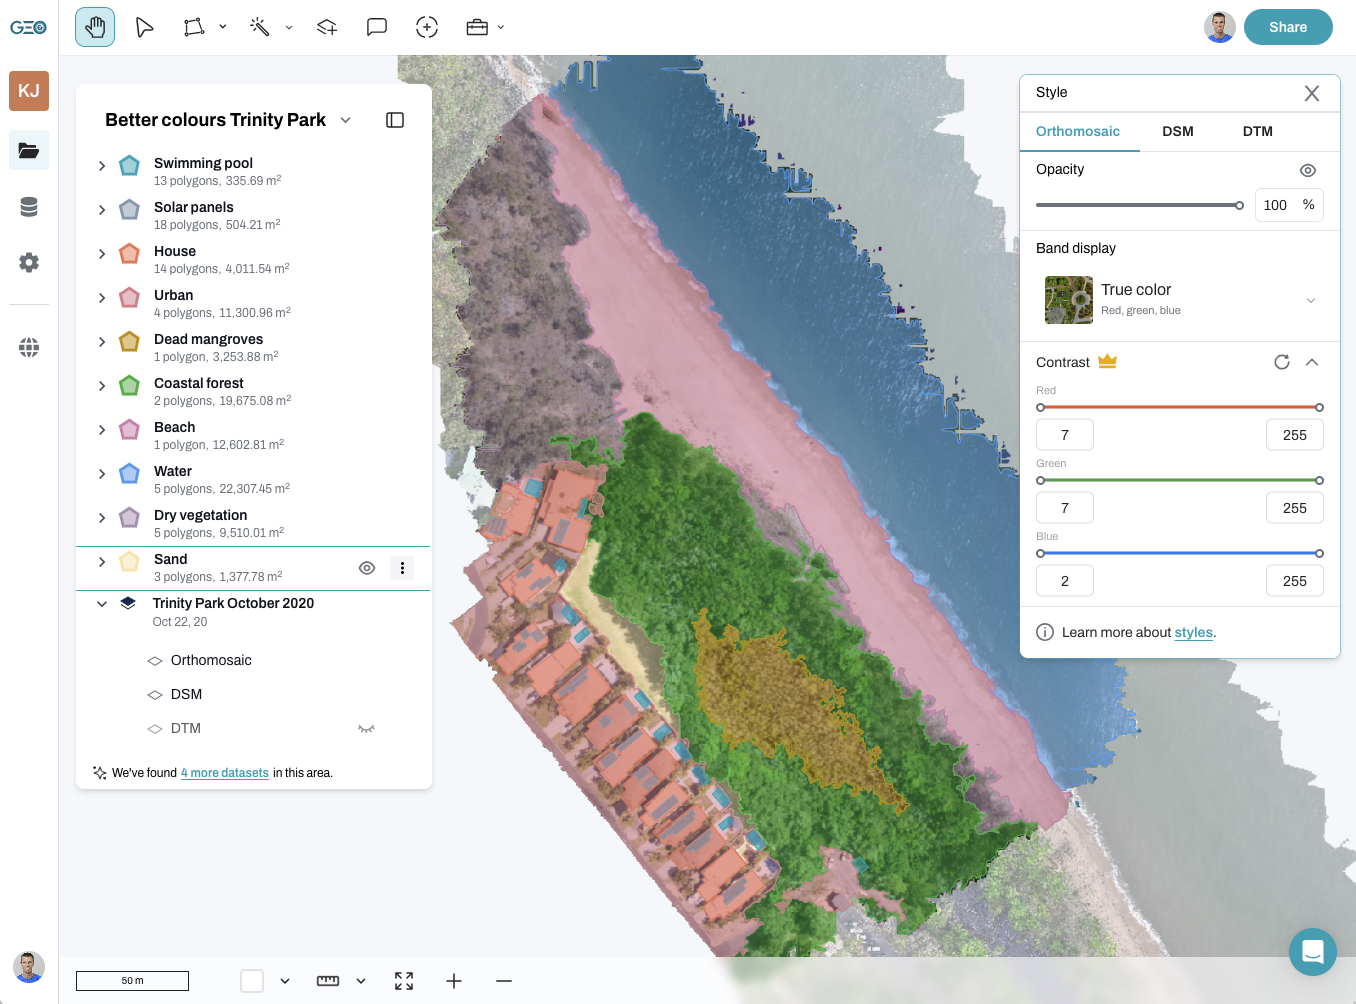
For a simple and accessible option, you can upload the dataset to GeoNadir by following the instructions. Additionally, feel free to explore and incorporate the dataset I captured, which includes a diverse range of features like buildings, bare ground, vegetation, and water, into your own projects. However, please bear in mind that while we strive to convert the multispectral sensor’s DN to reflectance as accurately as possible, the quality of this conversion depends on the information provided by the manufacturers.
What’s more, DJI also offers its desktop software -Terra – for data processing. Terra provides a suite of tools to generate outputs from RGB and multispectral datasets. So of course I requested for a trial account to see what it looks like.
Pros:
- Hardware Requirements: It requires at least 4GB of free RAM to process a sample 275-image dataset. This is a very small dataset, really only representing 55 photos (RGB + four multispectral bands considered as separate photos, so 5 x 55 = 275).
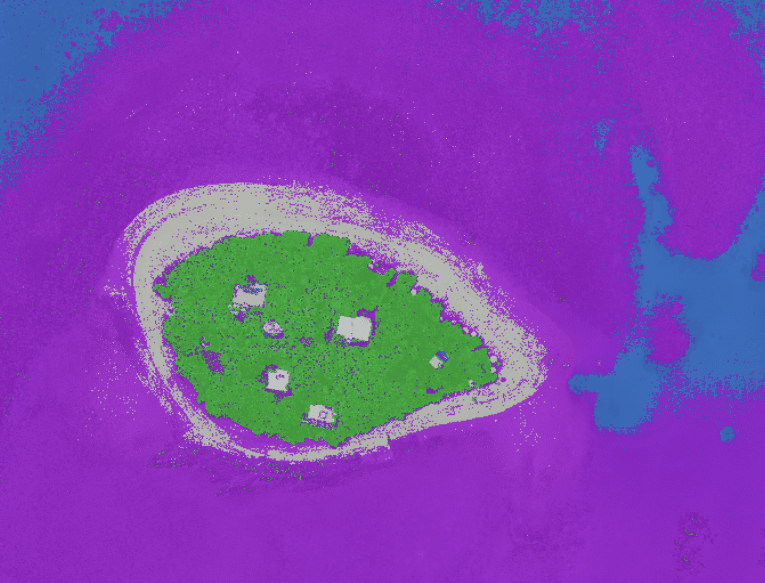
- Outputs: It produces an RGB orthomosaic as well as five vegetation indices (NDVI, GDNVI, NDRE, LCI, OSAVI) directly from the data. This is especially convenient if you need quick access to these indices without post-processing in another GIS or remote sensing software package.
- Processing Speed: It took only 8 minutes to process my dataset, which was very quick, but I do have a relatively fast computer. This speed will ultimately depend on your computer specs.


Cons
- Confusing terminology: Some of the terminology in Terra can be a bit unclear, which may confuse new users. Additionally, there are limited settings to adjust the orthomosaic process.
- Functionality limitations: I was unable to use features like “Annotation and Measurement” or “Agricultural Application.” This could potentially be due to being on a trial account, but it’s worth noting for those interested in these advanced features.
- Multispectral data: The multispectral bands are processed individually, with pixel values converted to a range between 0 and 2000. Unfortunately, Terra does not provide clear documentation on how these values are derived, which makes it less ideal for users looking to calculate precise reflectance values for each pixel.
- Hardware requirements: Although Terra worked on my PC, DJI recommends higher system settings, especially for larger datasets. My dataset was relatively small, but Terra’s minimum requirements suggest 32GB RAM and 4GB graphics RAM, while the recommended setup includes 64GB RAM and an Nvidia 2070 graphics card or higher. For larger projects, these more advanced configurations will ensure faster processing and support for more photos.
- Complex licensing and versions: DJI Terra offers a variety of licenses and versions, which can be confusing to navigate for inexperienced users. Prices range from AUD $490 to more than $6,000, with options for 1-year or permanent licenses. Different versions (Agriculture, Pro, Electricity, and Cluster) are available through both the DJI store and dealers, as well as costly annual maintenance and upgrade fees, making it important to carefully consider your needs before purchasing.
- Management and storage separate: As with any desktop photogrammetry package, it doesn’t come with any storage or data management options, so you will need separate solutions for those.
- No collaborative options: This is a standalone photogrammetry solution for creating products, but doesn’t have the ability to share projects or data with your teammates, clients, or stakeholders.

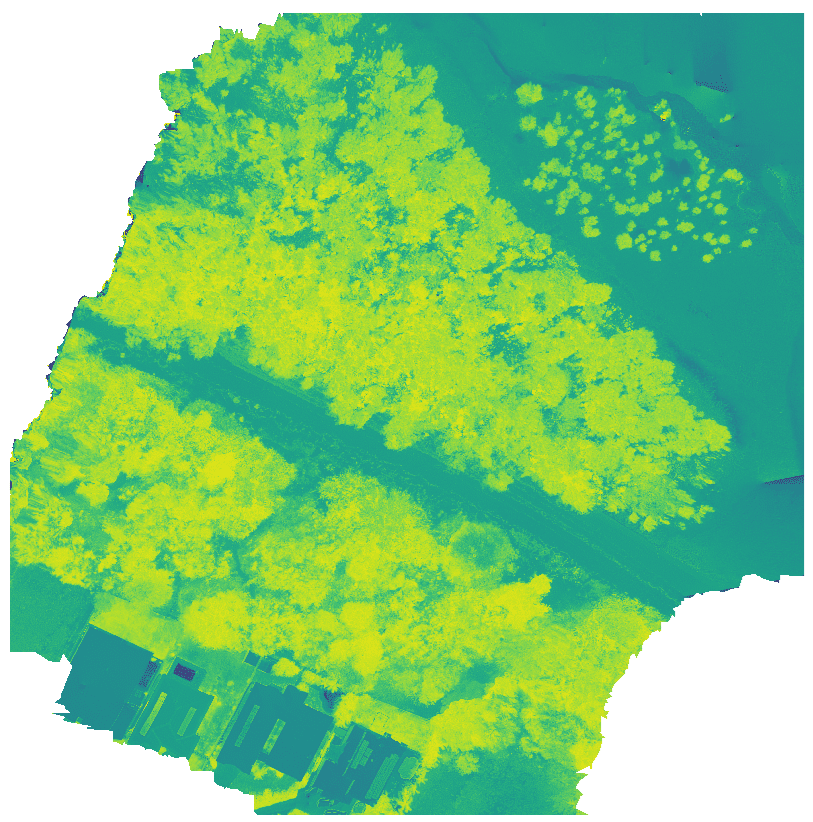
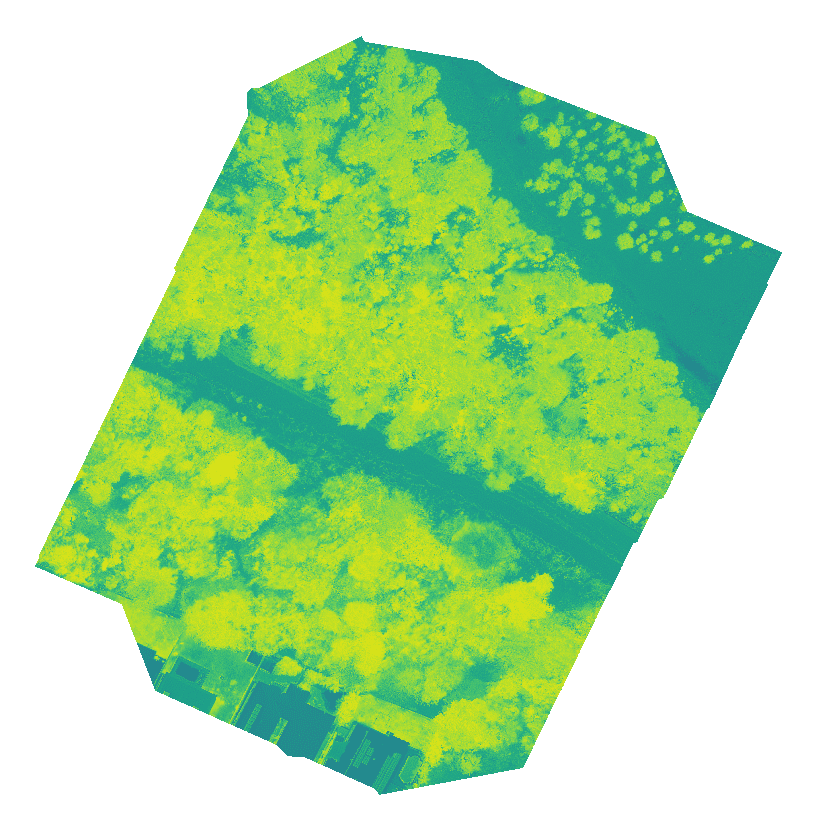
The index outputs from both Terra and our own processing are quite similar. The Terra output does appear to be automatically cropped to give clean edges. This is optional in GeoNadir.
Multispectral mapping wrap up
In conclusion, the Mavic 3 Multispectral, along with DJI Pilot 2 for planning and executing mapping missions is a great tool for capturing aerial multispectral data. But your investment doesn’t stop there, and the hardware is useless without a solution for data processing, storage, and management.
While Terra is a good option for a desktop photogrammetry software (see also other choices), it is reliant on high end computing hardware. It further specializes in processing the orthomosaic and set vegetation indices but doesn’t doesn’t provide a solution for managing, storing, or collaborating with your data.
Alternatively, GeoNadir can provide this more inclusive solution for you, and make it easy to incorporate your products into GIS and remote sensing packages for more advanced analyses. GeoNadir is an excellent option for processing your multispectral drone data, and with our growing range of geospatial AI and analytical tools, we are a streamlined and powerful solution for your drone mapping stack.
If you have any further questions or need assistance, feel free to contact us—we’re happy to help. A big thank you to EEGroup Aus for providing us with the demo unit for this review!
Index description
NDVI (Normalized Difference Vegetation Index):
Equation: (NIR – Red) / (NIR + Red)
Explanation: Measures the density of green vegetation, commonly used to assess plant health.
GNDVI (Green Normalized Difference Vegetation Index):
Equation: (NIR – Green) / (NIR + Green)
Explanation: Similar to NDVI, but more sensitive to chlorophyll concentration, making it useful for detecting plant stress.
NDRE (Normalized Difference Red Edge Index):
Equation: (NIR – Red Edge) / (NIR + Red Edge)
Explanation: Helps identify early stress in vegetation by focusing on the red-edge band, which responds to subtle changes in plant health.
LCI (Leaf Chlorophyll Index):
Equation: (NIR – Red Edge) / (NIR + Red )
Explanation: Estimates the chlorophyll content in leaves, aiding in monitoring crop health and nutrient status.
OSAVI (Optimized Soil-Adjusted Vegetation Index):
Equation: (NIR – Red) / (NIR + Red + 0.16)
Explanation: An improvement over NDVI, designed to minimize the influence of soil condition in areas with sparse vegetation.

