Earth observation data reveals valuable information that you should know. In the wake of the United Nations Climate Change Conference in Glasgow (#COP26) there’s even more than usual climate related information hitting the headlines.
And this just landed from Professor Peter Macreadie and team from Deakin University (and others), reminding us to consider the role of blue carbon ecosystems (e.g. mangroves, seagrass meadows, and tidal marshes) in our climate change models and solutions.
"Halting the destruction of coastal wetlands could avoid emissions of 304 million tonnes of CO2 pa, while restoration could sequester an additional 841 million tonnes CO2 pa" (via Twitter)
Why Mangroves?
Sure, mangroves might not have the greatest reputation.
They don’t always smell so good, and they provide a breeding ground for pesky mosquitoes. But perhaps that just means that we shouldn’t be building our houses right next to them.
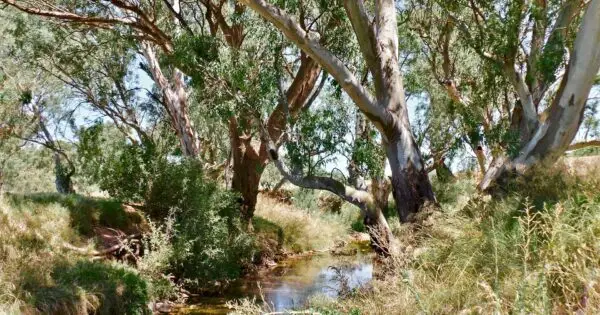
Looking past the inconvenience they may cause our noses, they punch well above their weight in terms of ecosystem services. In addition to their role in the blue carbon economy, they provide a nursery habitat for many juvenile fish species, and serve as valuable coastal protection from large storms and cyclones. That’s right, those severe weather events that are predicted to become more frequent and severe in the future due to climate change.
Earth Observation Data, How Can Drones Help?
While some companies are experimenting with tree-planting drones, let’s focus our attention on the role of drones in earth observation data- mapping and monitoring mangrove ecosystems.
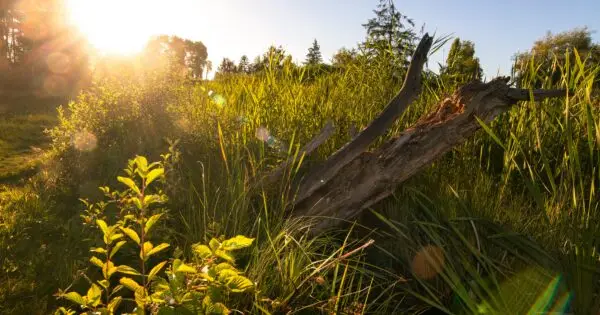
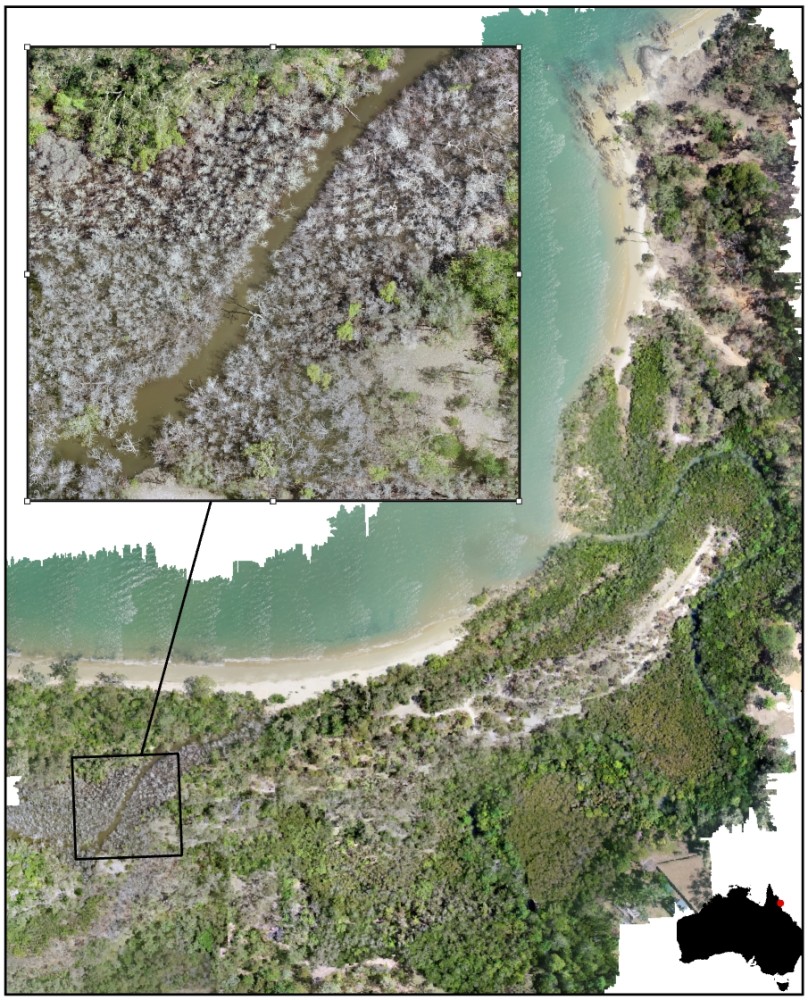
With the high level of spatial detail that we can obtain from drone imagery, we can peer down into individual mangrove tree crowns, like the ones here at Kewarra Beach.
From the accessible beach edge, the vegetation looks lush and green to a local beach goer walking their dog. However just beyond is a large patch of mangroves now devoid of their green foliage.
And these mangroves have been looking grey and dreary like this since at least October 2020, when I first began flying over the area.
With this level of detail, I’ve been able to track the senescence or ‘de-greening’ of a number of individual mangroves over the past year, but I started this work too late. And without Marty McFly and Doc, I cannot go back in time with my drone to work out when, or even why this occurred.
The limitations of drones
Resolution in remote sensing refers to the minimum interval of change that can be resolved or detected. Drones provide effectively unlimited spatial resolution, if you want to identify smaller features (leaves or branches for example) you fly lower or use a camera with more pixels or longer focal length. However, unless someone is interested in a specific location at a particular time it is unlikely that imagery will be collected. Further, the cheap and unlimited spatial resolution of drones creates constraints, the areas you can cover are small <10-100ha) and spectral resolution is restricted to red, green, and blue visible light. This creates an image we are familiar with but doesn’t collect all the information available.
Humans are good at identifying changes in their environment, but this usually means that the change has already occurred before a drone has collected imagery. Often the source may be beyond the range, or total area of change larger, than the capability of the drone. Many environmental problems and earth observation data require a larger area to analyse, and a time series of imagery to assist interpretation. Environmental changes happen in both space and time.
Satellites can help fill in the gaps
Satellite remote sensing missions like Landsat and Sentinel cover the entire earth on a regular and predictable pattern. These satellites orbit the earth at 600-800km altitude. The cameras on these satellites are carefully calibrated measuring devices that capture visible and non-visible light. But given their speed, distance and data transfer capacity these satellites have limited spatial resolution (10-30m). This means your average suburban house block will be 0.5-6pixels, not a very impressive real estate photo!
What a drone does very well is collect imagery of what and where. The high spatial resolution and natural colour are easily interpreted. Free, open access satellite imagery provides the when and how much through high quality regular measurements all around the world.
Through Sentinel-hub we can access these satellite data quickly and easily over any location on earth. The Sentinel-2 multispectral imagery used in this animation is 10m resolution and Kewarra Beach is captured every 5 days. It’s shown using near infrared light being displayed as red, which can be confusing if you’re not used to looking at data like this, but basically all the red areas are vegetated.
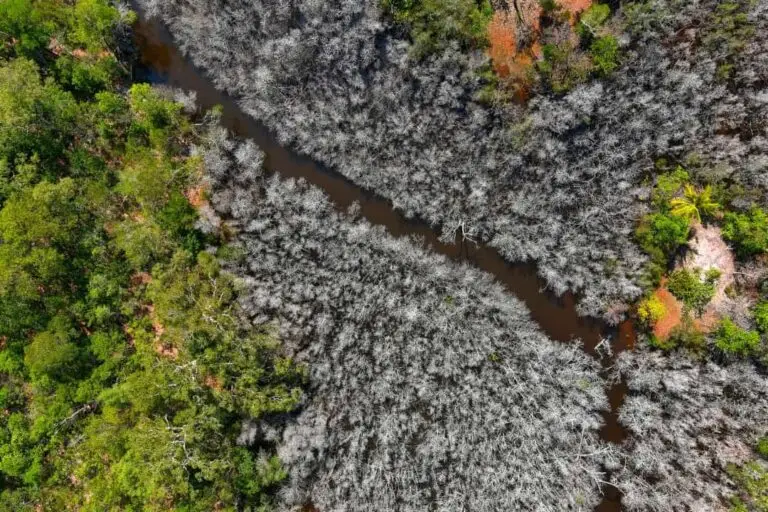
Early in the animation sequence the entire mangrove region is red, indicating healthy, dense trees. As the animation progresses, a dark patch becomes evident towards the centre of the scene, showing a rapid onset of senescence in early September, but may have started as early as mid August. This link shows the mangroves at Kewarra Beach on 30 October 2020 using Sentinel-2 data, the dark area shows dead trees. To view the area in more detail, view the drone imagery from 24 October 2020.
When an area of mangrove dies, drone imagery provides the what and where at individual tree scale. But the ‘when’ is difficult without regular satellite imagery. Combining both forms of earth observation data together helps us tell a clearer story.
Drone imagery collected with a purpose and planning can provide vital context to interpret satellite imagery. The value of open accessible remote sensing data is difficult to overstate if we are to make better decisions about how we manage the earth.
If you’d like to create your own animation using satellite imagery, follow these easy steps on Sentinel-Hub.