In a recent lunch and learn webinar we explored the role of drone mapping in detecting environmental change. Here I’ll revisit the highlights of the webinar, diving into the aftermath of Tropical Cyclone Jasper and examine how comprehensive datasets can reshape disaster response strategies.
Tropical Cyclone Jasper threatened the far north Queensland region, providing an opportunity for strategic data collection before its anticipated landfall near Cairns. This slow-moving system provided sufficient time to capture and curate data for the ‘before’ baseline. As the weather cleared we once again captured data to explore the impact of the cyclone and subsequent flooding.
Table of Contents
Detecting changes on beaches and rivers
In December 2023, the Cairns council was due to open a new foot bridge connecting two norther beaches. We were particularly interested to see if the bridge would hold up against the storm and thankfully it did! But that’s not to say that the beach and waterway around it didn’t change.
The comparison below reveals changes in beach morphology and an expanding creek mouth. You can also see a significant amount of debris on the previously clean sand.


It’s not always possible to capture drone data prior to an event occuring in this way. Sometimes the conditions may not be appropriate. And in other cases, perhaps an impact occurred where we were not expecting it.
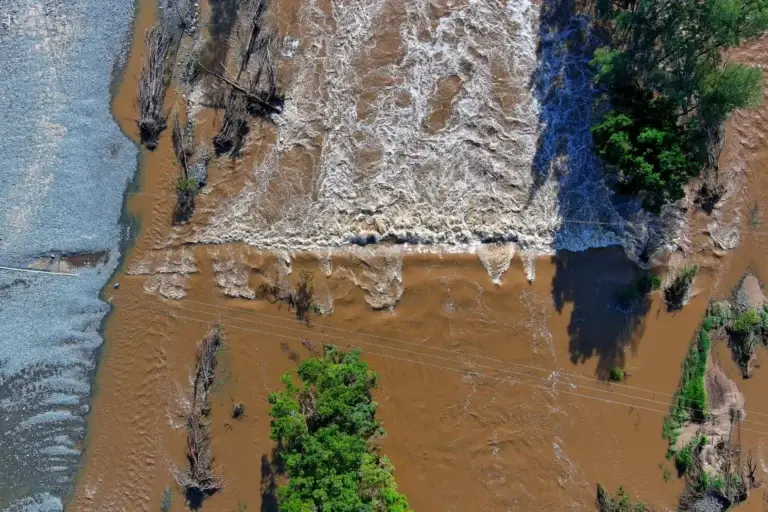
Although we knew that the Barron River held the highest risk of flooding, we did not manage to drone map any part of it before the cyclone passed through. However, we were able to acquire data once the flooding subsided. In this case, we’ve been able to detect change in the drone data by comparing with satellite imagery.
In the image sequence below, you can see the widened river bank, particularly on the southern side. This highlights how much vegetation was carved away during the flood, exposing the banks to further erosion.
Close to the middle of the scene, you may also notice that we lost a rail bridge for sugar can trains.
Of course the high spatial resolution drone data against the backdrop of undated satellite data also highlights another benefit of using drones for detecting change.


Collaboration in action
We were able to use GeoNadir’s collaborative capabilities help prioritize areas of interest for further data capture. We developed a project in GeoNadir that we shared with the team for all to view available data and suggest areas for additional coverage. Being able to collaborate in real time to make decisions on when and where to fly helped streamline the entire process. It also meant that we were able to keep everyone on the same page, even if they didn’t have drone mapping or geospatial experience.
After we captured the data, keeping in all in a central repository for the team to explore at will was important. The compare tool within GeoNadir projects made this particularly simple.

Quality Matters: Efficient Data Capture
Drone mapping over waterways like this can be challenging to get a good result. This is because the algorithms that we use to orthomosaic the individual photos together work well with clearly defined static features seen in multiple adjacent photos (e.g. buildings, paths, fences). Rivers in flood may be moving rapidly and this can be confusing for the algorithms. Sometimes they may also be relatively ‘featureless’ – smooth brown surfaces where one part of the river is indistinguishable from the next. And finally, sunglint on the surface wreaks havoc on the automated processing!
Any or all of these challenges can result in artefacts in the data processing, or at worst failing altogether.
To have the best possible change of a good orthomosaic result under these conditions, the key is to make sure that all photos have something other than than water in them. So keep the following in mind:
- Fly higher than you might otherwise want to (within legal range of course!). This will increase your photo footprint and give you a greater chance of capturing non-water features in every photo.
- Orient your flight path in the direction of the river. In the example above, you can see that a north-south oriented plan may result in ‘water only’ photos. But there is a great chance of capturing some static ‘non water’ features when flying in an east-west orientation.
It’s evident that data readiness is a linchpin in effective disaster management. The ability to capture, collaborate, and analyze data efficiently empowers communities to proactively address natural disasters and their impacts. This recap offers a first peek into the data captured before and after Cyclone Jasper, demonstrating how drone mapping can be used within the disaster management cycle Stay tuned for more insights into the evolving landscape of technology-driven disaster preparedness, and quantitative results from these studies.
Did you enjoy this article? You might also like the following: