Who wouldn’t want a house with an ocean view? But for people in Nova Scotia, building a house on the waterfront can be riskier than many homeowners might realise. Coastal erosion is steadily chewing away at Nova Scotia’s coastline, placing homes and infrastructure at risk of washing away. The Applied Geomatics Research Group at Nova Scotia Community College (NSCC) are using drones to measure erosion and improve our understanding of the problem. Nick Matuchet is one of the members of this research group.
Quantitatively measuring coastal erosion
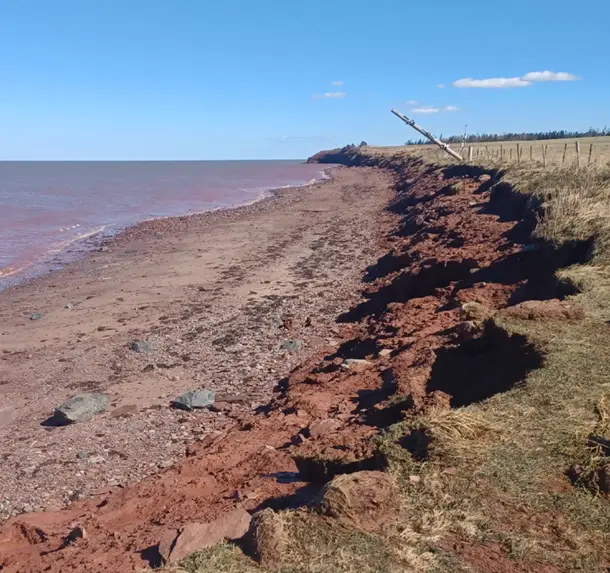
You don’t need fancy equipment to notice that coastal erosion is happening. Locals have been watching their land slowly disappearing for decades. But quantifying the scale of erosion and how quickly it’s happening is difficult to do from anecdotal evidence alone.
Cottage Cove is one region where locals have noticed significant erosion in the past.
“From talking to people that have lived in the area for 40-50 years, they’ve told me that they actually had to move the road four times because of the coastal erosion,” Nick said.
Why Nova Scotia is disappearing into the sea
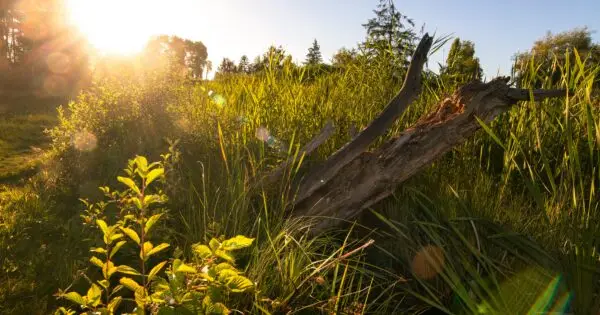
The ocean is a powerful force and it’s responsible for the dynamic nature of many of the world’s shorelines. But a combination of conditions makes Nova Scotia more vulnerable to coastal erosion than other regions. Where other coastlines may have large rocky cliffs to withstand the battering of waves, large sections of Nova Scotia’s coast are mostly mud, which is much less resistant to erosion. Many of these muddy coasts have also lost the natural vegetation that once helped protect them from erosion. Sea-level rise is also expected to be higher than the global average in Atlantic Canada. Combined with a predicted increase in storm frequency and intensity, coastal erosion won’t be going away anytime soon.
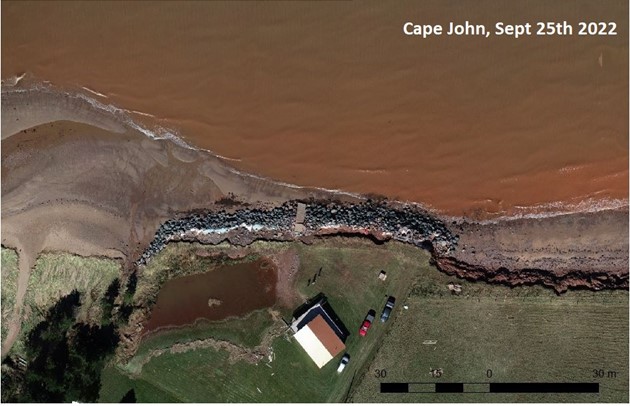
As someone who flies drones for work and fun, Nick decided to map Cottage Cove. He wanted to create a record that could be used to detect and measure future erosion. High-resolution RGB orthomosaics, like Nick produced of Cottage Cove, are one way to do this.
Another method, which provides more quantitative data to measure erosion is drone mounted LiDAR. LiDAR is what the Applied Geomatic Research Group, is using to quantify erosion as part of their studies.
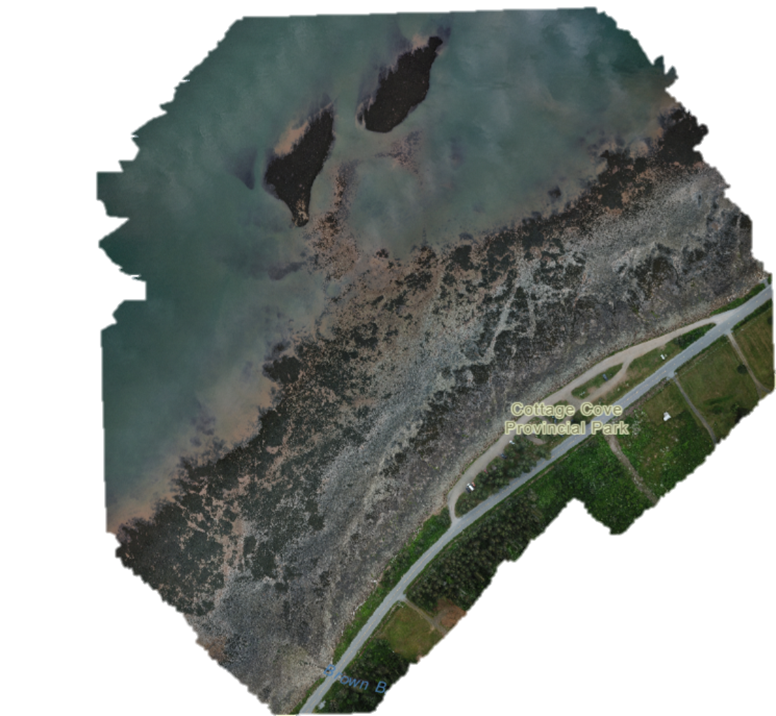
Cottage Cove, a region in Nova Scotia where locals, in the process of settling property agreements, sought to analyze coastal erosion trends that have significantly impacted the area in recent decades. Mapped by Nick Matuchet.
Mapped by Nick Matuchet. View the dataset on GeoNadir.
How LiDAR can measure coastal erosion
LiDAR works by emitting beams of light of specific wavelengths and measuring the time it takes for those beams to be reflected back by surrounding objects. This time can then be used to calculate the distance to objects. By mounting LiDAR on an aircraft or drone, researchers can collect detailed topographic data over a large area. They can use this data to make detailed comparison over time to measure where and how much erosion has occurred.
For mapping large areas, there are generally two options for aerial LiDAR: drones and aircraft. The NSCC team have used both methods to track erosion, but they are starting to use drones more often. Currently, the team collects about 80% of the LiDAR they use with drones.
Nick says the difference between using aircraft and drones is huge.
“With the Matrice300 and L1 sensor, we can decide in the morning if we want to go film or collect LiDAR of an area. Whereas with the plane, there’s more scheduling required. We have to organize with a third party that will rent us the aircraft. The weather conditions below the aircraft have to be favourable, basically no low cloud. The drone allows us to capture precisely what we are looking for, at angles unachievable by traditional airborne sensors. ” Nick said.
“You’re kind of putting your faith in a lot of other systems.”
Drones also make it easier to use LiDAR at an oblique angle rather than just top down (nadir). This allows Nick and his team to capture data at an angle, revealing features like overhangs that might not be visible in nadir imagery.
Mapping damage from hurricane Fiona
While coastal erosion is a continuous process, events like severe storms can rapidly cause a lot of damage. The ability to quickly and flexibly map somewhere at short notice can be very important for quantifying erosion from these events.
This is something Nick and his team recently experienced with Hurricane Fiona.
“We actually just got hit by a big hurricane about a month ago, a little less. It was hurricane Fiona, and it had sustained winds over 100 kilometres an hour for a long time. It blew a lot of trees down, but it also caused a storm surge,” Nick said.
Because the hurricane was forecast, the team had time to quickly map an area of concern before the storm arrived.
“So we went up on a Thursday or Wednesday before the storm and mapped the whole property extensively,” he said.
“We went back the day after the storm on Sunday, and it was just, it was really sad to see this giant piece of the coast had been just chewed out from just smashing waves.”
“Now we’re going to see how the land has kind of settled and slumped after almost a month now. And we’ll be able to compare, like, how much coastline did we really lose?” Nick said.
Nick can quantify how much land was lost due to the hurricane by comparing LiDAR from each of these mapping missions.
 After Hurricane Fiona
 Before Hurricane Fiona
Source: Nick Matuchet
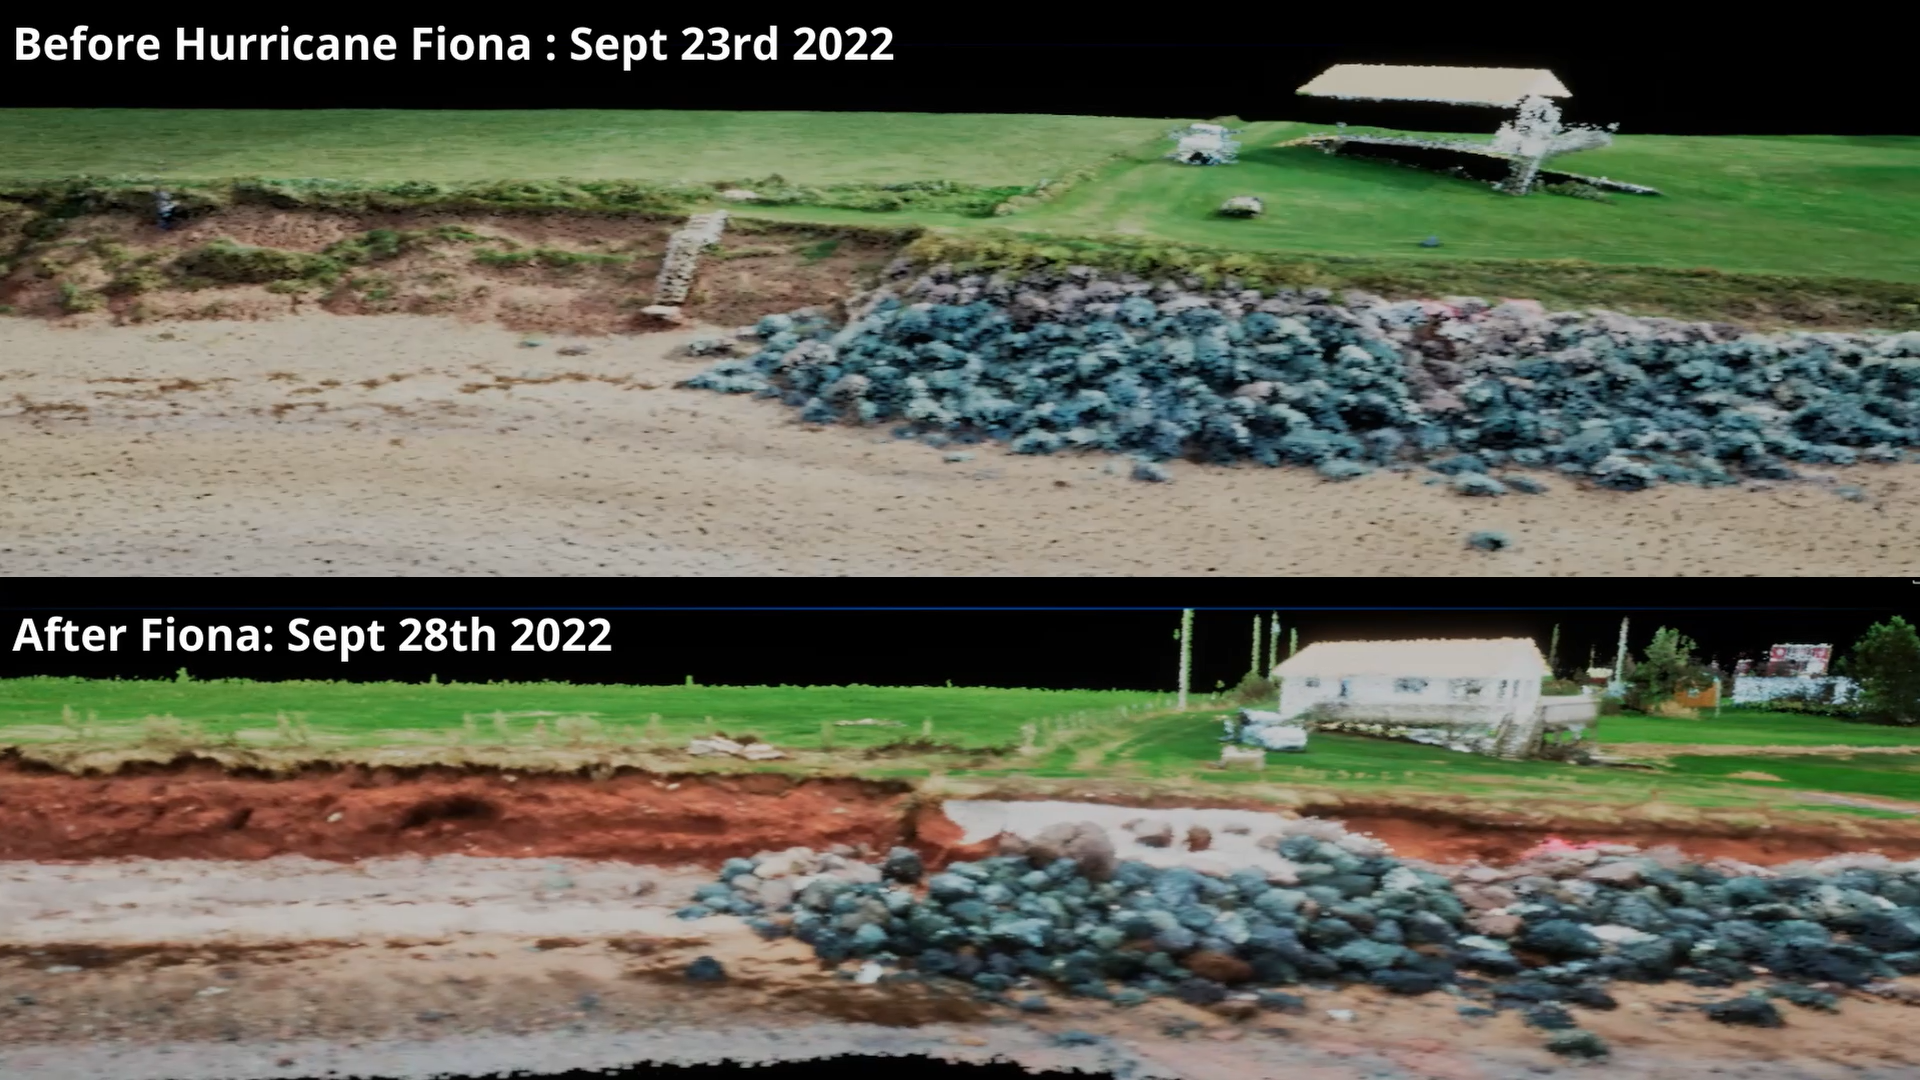
Coastal erosion before and after Hurricane Fiona. Source: Nick Matuchet
How does measuring coastal erosion help?
Nick says that people often question the point of accurately measuring coastal erosion.
“I just see these comments of like ‘Yeah, everybody knows erosion is happening’ and ‘What is there to say about it?’” Nick said.
“But it’s kind of like, a lot of people still don’t really get it in a lot of ways. And if we can measure it, I think that’s the final thing that will convince some people to think, yes, we know it exists. But now we can measure it and say, this is how much you can expect per year, and plan accordingly.”
“With such a long time horizon on something like erosion, it’s not like we can look in five years and think, ‘Oh my God, this is a really big problem. I wish we could go back in time and measure this.’”
Data like this could also be invaluable for helping researchers test different coastal protection measures to combat erosion.
Explore more datasets on GeoNadir
You can explore more interesting drone mapping datasets on GeoNadir, or upload some of your own datasets. You can get started storing, analysing and sharing your datasets for free. Plus, you’ll be helping make drone data more widely available for everyone!
If you liked this story, you might also like to read:
- Drone surveying: The new go-to for measuring elevation
- How drones are improving landslide risk management in Brazil
- Types of environmental sensors for drones