
It might have been planted to suppress dust and provide cattle fodder during a drought in central Australia, but buffel grass has taken over the landscape with disastrous results.
As an invasive species, buffel grass is able to take advantage of conditions that are not so friendly for native grasses. In particular, it can grow very quickly, even in dry conditions. This means that not only does it outcompete native species, thus reducing biodiversity, but it also builds high fuel loads. In turn, this leads to hotter and more frequent fires in the landscape.
Buffel grass also poses a significant social and cultural threat to Aboriginal people. It outcompetes native food and medicine species, makes it difficult to navigate through country, disguises animal tracks, and destroys cultural sites through primary and secondary impacts.
What can drones tell us about buffel grass?
When the buffel grass is carefully and meticulously excluded, the native flora and fauna can return. This is visible in the drone image below from Tjoritja National Park near Alice Springs – the native grasses are green, while the invasive buffel grass is more of a grey colour. The grey buffel grass visible in clumps at the exclusion of the native grasses. Drone imagery makes it possible to quantify these changes over space and time.
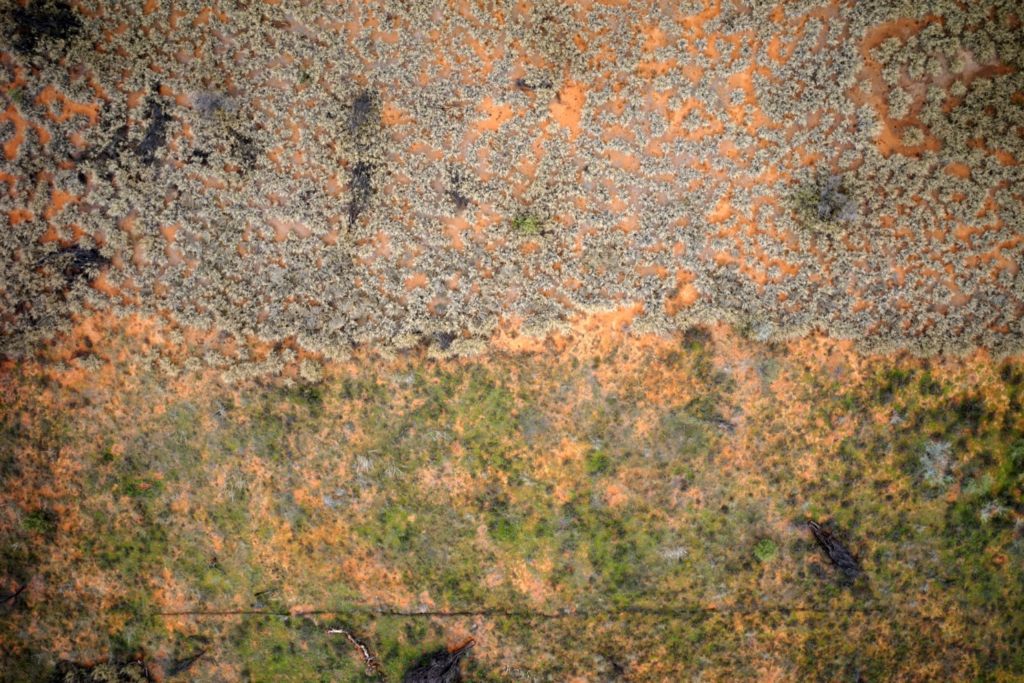
In terms of a broader context, the drone image above is just one of a series of images that we used to create an orthomosaic and 3D model of this study site. The area is the research site of Dr Christine Schlesinger from Charles Darwin University. I was really lucky to hang out with her briefly to visit her site and capture these drone data. Her buffel grass exclusion zone is a rectangle in the landscape, approximately 100 x 150m in size. The area below the rectangle is part of the study site too – as the control. The control depicts what the environment would look like in the absence of intervention.

Data processing reveals ecosystem structure
Not only is the colour of the grass evident, but by looking at the 3D digital surface model (DSM) on the right hand side above, it’s possible to see structural differences in the imagery as well. The native grasses in the exclusion zone don’t grow as tall as the surrounding buffel grass and shades of orange and red indicate the taller grasses. Trees are also easy to see in the DSM due to their height above their surrounds.
It’s so easy for drones to capture this type of data! It took a mere six minutes to cover the entire site, in contrast to the time that my colleague Dr Schlesinger takes to manually plot the area.
I won’t argue that field survey is meritless. Certainly the level of detail captured in the field far surpasses drone imagery. So it’s not an either/or solution – it’s both. And it’s important to recognise the limitations of each while playing to their strengths. Just like we collaborate as scientists, the data can collaborate too!
Tech Specs
Drone: Aeronavics Bot
Camera: Sony a7R
Overlap / Sidelap: 85% / 75%
Flight Altitude: 60m
Date / Time of capture: 2nd July 2016; 2pm ACST
Drone Operators: Dr Karen Joyce and Dr Susannah Leahy, James Cook University