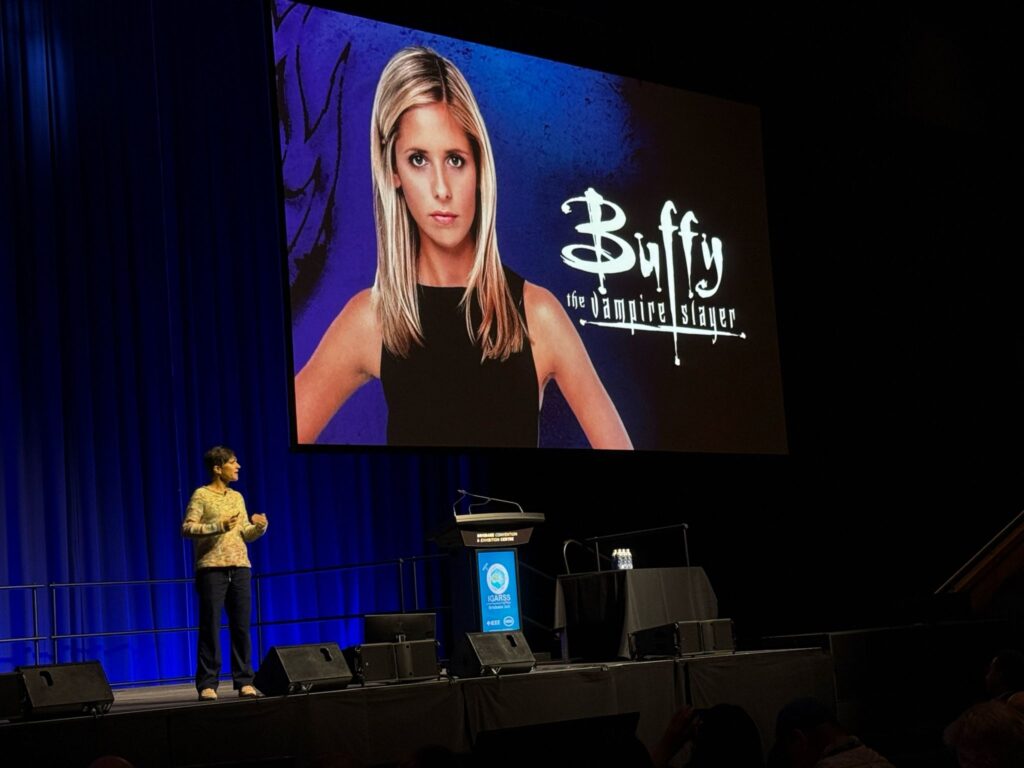
What doesn’t show up in my academic bio is that I’m a huge fan of Buffy the Vampire Slayer. Yes, the 90s show. And no, this isn’t a diversion, I recently realised that it’s actually the perfect metaphor for the Earth observation industry!
If you don’t know Buffy, here’s a snapshot of how she’s introduced: “In every generation there is a chosen one. She alone will stand against the vampires, the demons and the forces of darkness. She is the Slayer.”
Buffy is powerful, capable, and responsible for fighting all the demons, alone. Sound familiar? It reminded me of how we often treat remote sensing: as something for the elite, the highly trained, the “chosen few” with access to tools and data. But the threats we’re up against like environmental degradation, climate change, ecosystem collapse are growing. Just like Buffy’s demons, our data demons are multiplying.
And it’s time we imagine how we fight back.
Contents
The data demons are multiplying!
In the early days of EO, it was pretty much Landsat or aerial photography. Now? Earth observation datasets are growing by over 100 petabytes per year. We have the wonderful national programs like those from from NASA and the European Space Agency, then add in commercial operators and even some universities, and we’re absolutely flooded with data.
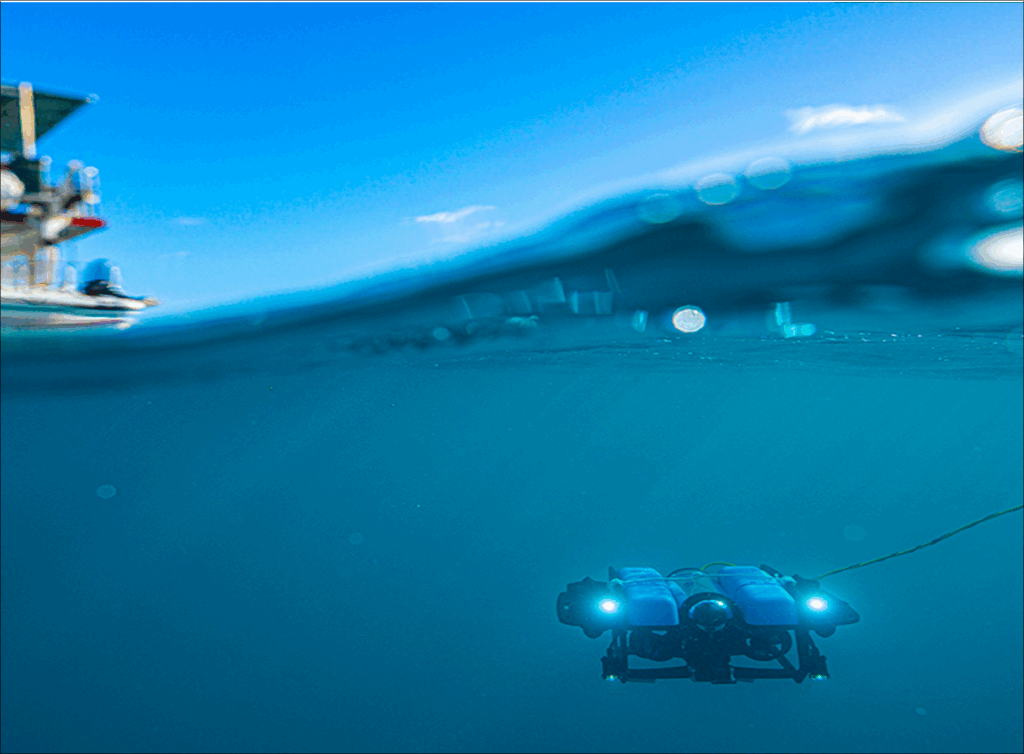
And it’s not just satellites. Where I work on the Great Barrier Reef alone, we have imagery from underwater ROVs, on-water drones, and aerial drones – all at different scales. Managing it all is like fighting a vampire horde with a single wooden stake.
We’re using increasingly complex tools, but we still analyse only a fraction – 1% – of available EO data. That’s not sustainable. If Buffy only slayed 1%, we’d all be toast.
What would Buffy do?
By Season 7, Buffy is nearly overwhelmed by the sheer scale of the demon threat. So what does she do?
She changes the rules.
Instead of being the only one, she activates everyone who has the potential to be a slayer. Suddenly, there are slayers all over the world. It’s the ultimate story of empowerment and democratisation.
We need to do the same in EO. We need to stop pretending that only the “chosen few” can understand or use these tools. If we want to slay our own data demons, we need to open access, share knowledge, and build intuitive tools that empower others.
Three ways we democratise Earth observation
If we’re serious about making EO more accessible, we need three things:
Support and training. Like Buffy, we need to keep educating and training. We’ve got strong university programs, and She Maps helps train kids early, but demand is growing faster than our capacity to teach. And like Buffy realised, training alone isn’t enough. We need to change the game and the rules.
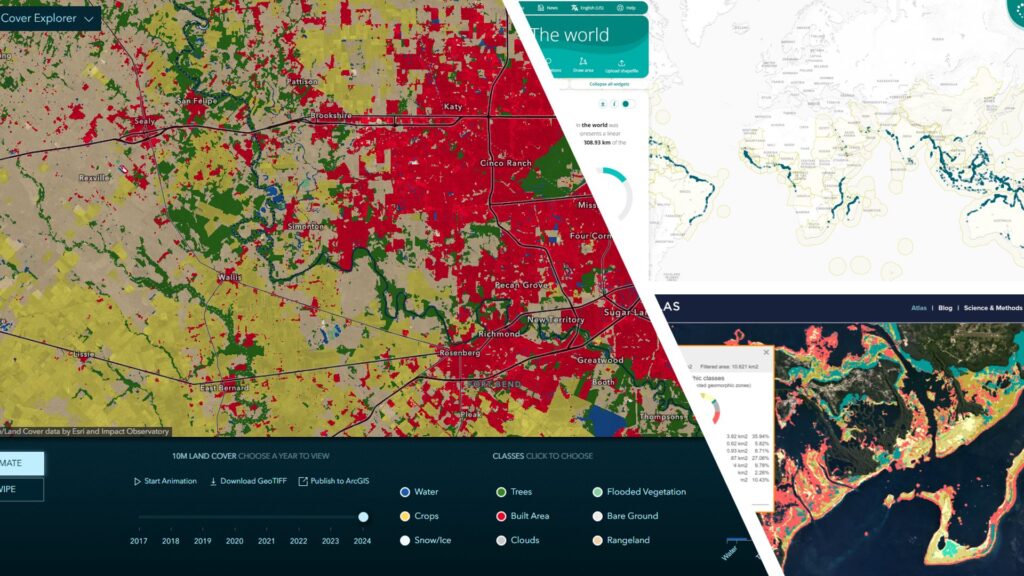
FAIR data. Open, well-documented, accessible datasets are key. Platforms like GeoNadir host drone mapping data from 90+ countries, all FAIR. But FAIR isn’t free. Hosting these datasets often relies on individuals or underfunded programs. How do we support more people – including academics – to share rather than hoard?
Intuitive tools. Think Canva for design, or Google Maps for navigation. They didn’t kill the professional industries, they lifted the baseline. Let’s do the same for EO. We need analysis tools that make people powerful, even if they’re not trained remote sensing professionals. We’re seeing some cool work come out of Felt and Bunting Labs as an example.


What this looks like on the Great Barrier Reef
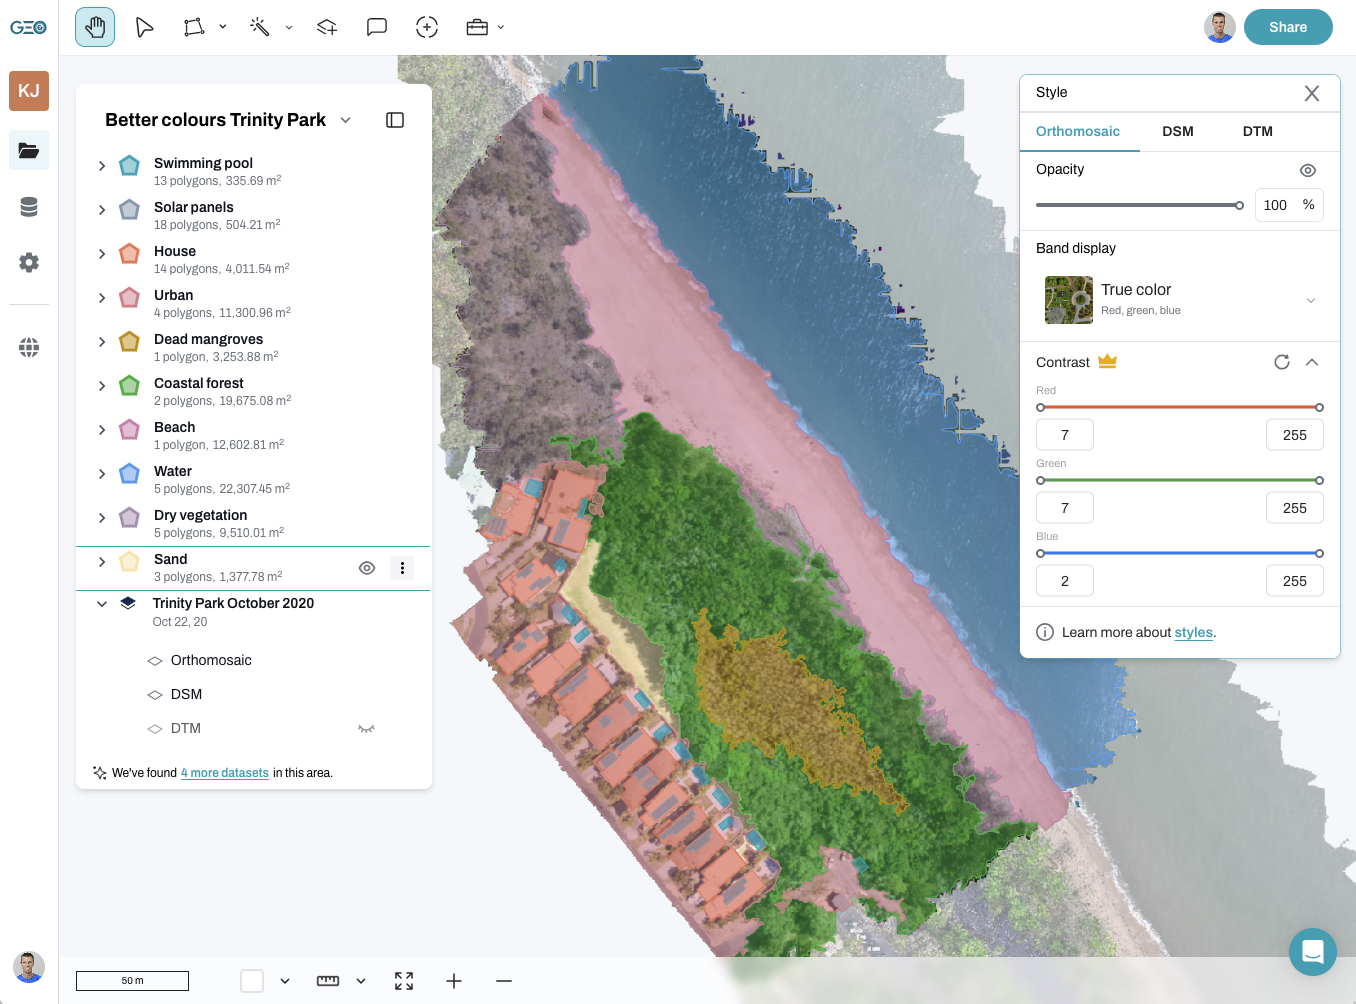
Let’s zoom in to Lizard Island on the GBR. When Dr George Roff (CSIRO) happened to fly his drone over a coral reef during the March 2023 bleaching event, he uploaded the images to GeoNadir.
Because those data were FAIR, our team (including James Cook University, Macquarie University, and Griffith University) used them as a baseline for our follow-up surveys three months later. We used intuitive, multiplayer mapping tools to work together – even with varied GIS experience – and found that 97% of corals had bleached. Worse, 92% died (read the open access research article here).
Had those data been locked in a drawer, we would never have pieced together the full story.
Scaling up from reef patches to regions
This work doesn’t stop at one reef.
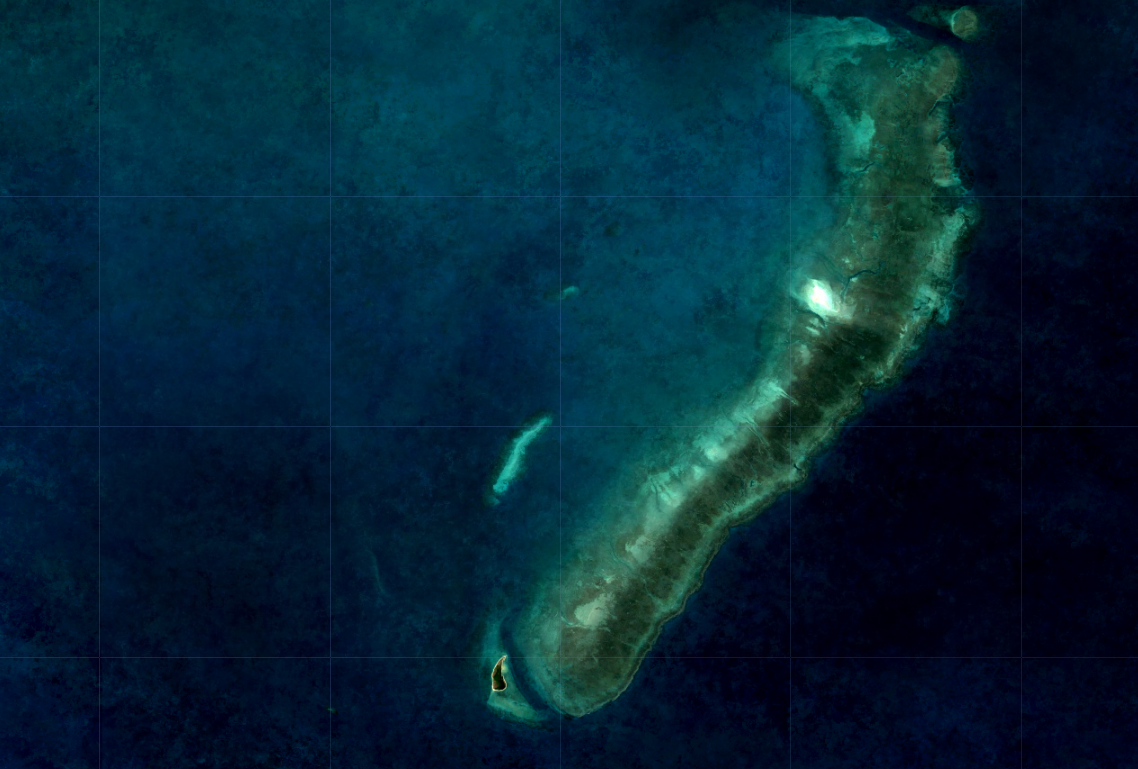
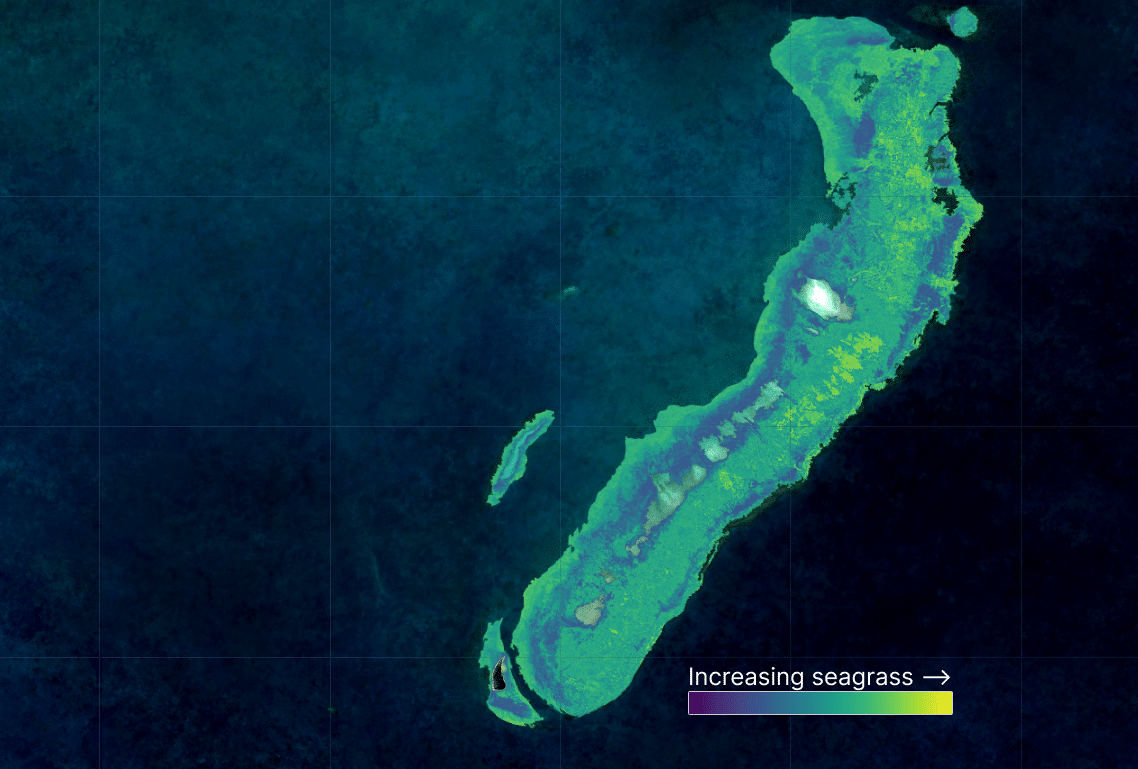
In the Torres Strait, I processed 194 Sentinel-2 scenes to make a cloud free composite image, then mapped seagrass using drone and ROV data. From there, we calculated seagrass density at the satellite pixel level, scaling that up to create regional maps. All possible because of FAIR data from the European Space Agency.
And on GeoNadir, we’ve got data from 90 countries. That kind of global, open resource makes scaling possible. But… here’s the catch.
At the moment, most of the complex analysis I do requires challenging software workflows. The software options are incredible, sure. But not exactly accessible. Not “Canva-level” easy. Yet.
Make Earth observation as easy as Google Maps
Google Maps didn’t teach the world spatial analysis. It made it invisible.
That’s the power of good design. When people don’t even realise they’re doing something complex. We should aspire to the same for EO. People shouldn’t need a PhD to understand where seagrass is declining, or which reefs are at risk.
We already have the data. We already have the urgency.
Now it’s time to pair that with intuitive tools, foundation models, LLMs, agents, VLMs, whatever it takes to help people slay data demons without needing to become a technical wizard.
Here’s the part where you make a choice
This is your Buffy moment.
You can keep doing amazing remote sensing work as part of the chosen few. Or you can help democratise it by supporting training, publishing FAIR data, or building tools that make it easier for others to join in.
Because the next generation of EO slayers won’t come from elite labs. They’ll come from classrooms, ranger stations, grassroots communities if we give them the chance.
So I’ll ask you:
Are you ready to become an EO slayer?
I created this blog based on my keynote presentation at the International Geoscience and Remote Sensing Symposium, Brisbane, Aug 2025. Thank you to the organising committee for inviting me! Banner image credit: Gavin Kennedy.