In the past, satellite imagery has been one of the main methods of data collection for remote sensing. As drone technology continues to advance, drones have begun to challenge satellites as a significant data collection method in many fields. Each method has its own unique advantages and disadvantages. But the combination of the two technologies can provide insights that neither can achieve on their own. A team from the Arizona Remote Sensing Centre learned just that when they were assessing vegetation change in the Santa Catalina mountains after a wildfire.
Fires and floods
In 2020, the Bighorn fire burned over 500 square kilometres of the Santa Catalina Mountains in Pima County, Arizona. After such a big fire, most people wouldn’t immediately be worrying about floods. But these two natural disasters are more linked than you might realise. Fires, especially large, hot fires, can significantly change the amount and kinds of plant life in an area. Depending on how bad the fire is, the impact can last for years afterwards.
Vegetation in a catchment can have a big influence on flooding. When there’s less vegetation, more water runs off, rather than being absorbed by the soil. It also tends to run off faster. So when a catchment has lost a lot of vegetation, floods can be bigger and peak more quickly. That makes them more dangerous.

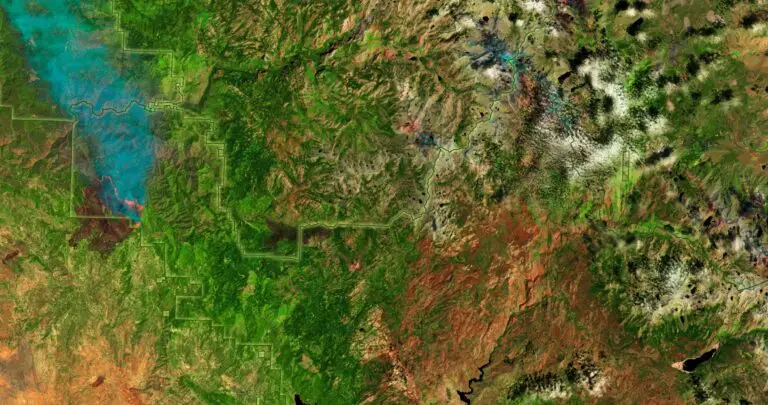
Sentinel-2 imagery of the Bighorn Fire in June. The fire continued to burn until July. Source: Arizona Remote Sensing Centre
Satellite images of the Bighorn fire give an indication of just how much plant life burned across a large area of the Santa Catalina mountains. These mountains are a main catchment for the city of Tucson. After such a large, intense fire, Pima County Regional Flood Control District (RFCD) was concerned about increased flood risk. They wanted to figure out how much, and what kinds of vegetation the catchment had lost. Hydrologists could then use this information to predict how flood risk had changed. It was up to a team from the Arizona Remote Sensing Centre (ARSC) to figure out how vegetation had changed.
Wrangling with the scale of the problem
Looking at how vegetation changed meant looking at over 500 square kilometres of land. That’s far too large an area to assess on foot and too large to assess with drones. When you’re looking at something at that scale, your only options are really satellite and aerial surveys. But the problem with these sources of data is that, what you make up for in the area covered, you often lose in resolution.
Satellite resolution
If you’ve ever really zoomed in on a satellite image, you’ll have noticed a point where you can’t see individual objects anymore. Instead, you just see lots of different coloured pixels. The size of these pixels is the resolution of the image. The colour of the pixels is a mix of all the spectral signatures of the objects in that pixel.
So, if you have a satellite that takes 15m resolution imagery, you won’t be able to see anything smaller than 15 metres squared. Even something larger than 15 metres squared could be difficult to make out since it might fall across multiple pixels. If that happens, its spectral signature will mix with surrounding objects, effectively blending it into it’s surroundings.
The ARSC team had access to 3m resolution, commercial satellite imagery. But even then, most plants are smaller than 3m. So while areas of dense vegetation might be easy to pick out because of a clear ‘green’ signature, areas with a mixture of bare ground, dead plants and live plants could spectral mix into something that isn’t easily recognisable as any one category. Even when you can tell something is a plant, how can you tell whether it’s a tree, shrub or grass?
Combining satellite with other data sources
If they wanted to get accurate results, the ARSC team knew they needed more than satellite imagery to figure out how vegetation had changed. So they also looked at LiDAR data, which measures changes in surface elevation. LiDAR could tell them the heights of plants, which told them if they were trees and shrubs or grass. But it couldn’t tell them whether the plants were alive or not. That led them back to the problem of spotting the spectral signatures of living plants in 3m resolution satellite imagery.
Using drones to support satellite machine learning
Machine learning works by feeding a computer algorithm pictures with and without a labelled feature of interest. From these training images, the algorithm learns to automatically identify those features in other images. The ARSC team needed an algorithm that could tell the difference between bare ground and different types of alive and dead vegetation from satellite images. To do that, they needed to identify areas in the satellite images that had these qualities to use as training images.
But hang on, aren’t we just going in a circle? Isn’t the resolution of the satellite imagery too low to accurately identify these features? So how did the team do it?
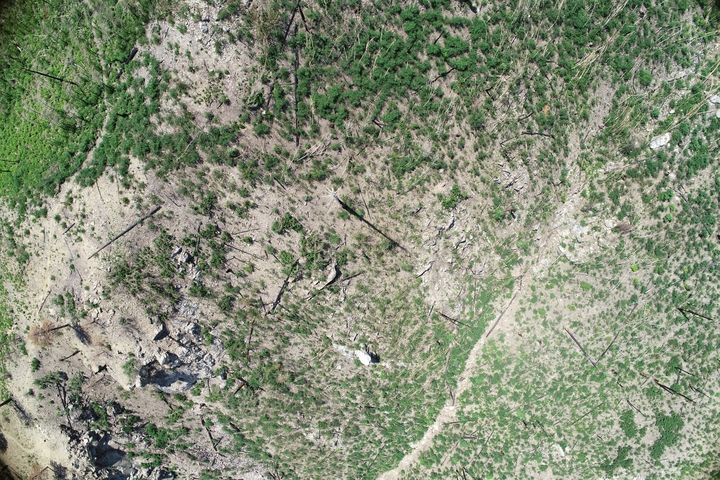
Well, although the total burned area was too big for drones to map, drones could help identify good locations to train the machine learning algorithm. By mapping areas with the different features of interest with the drone, they could match them to the satellite images. The team could then feed the machine learning algorithm correctly labelled satellite images so the algorithm could accurately categorise areas the drone hadn’t mapped.
The end result
Using all these different data sources, the ARSC team could map how vegetation changed pre- and post-fire across the whole burn area.
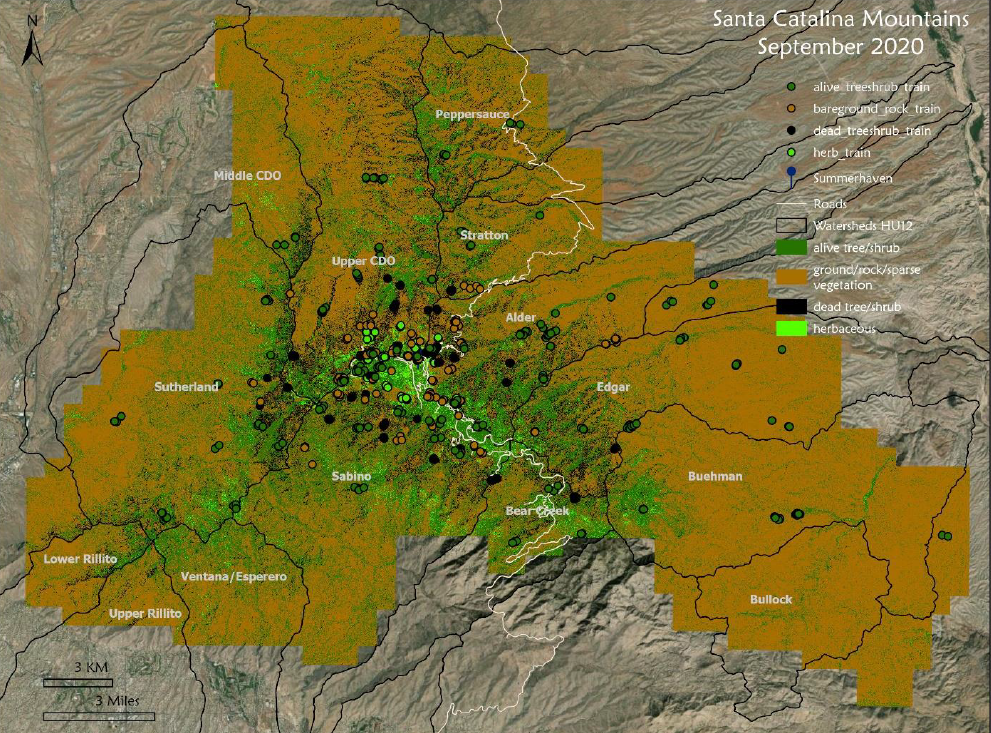
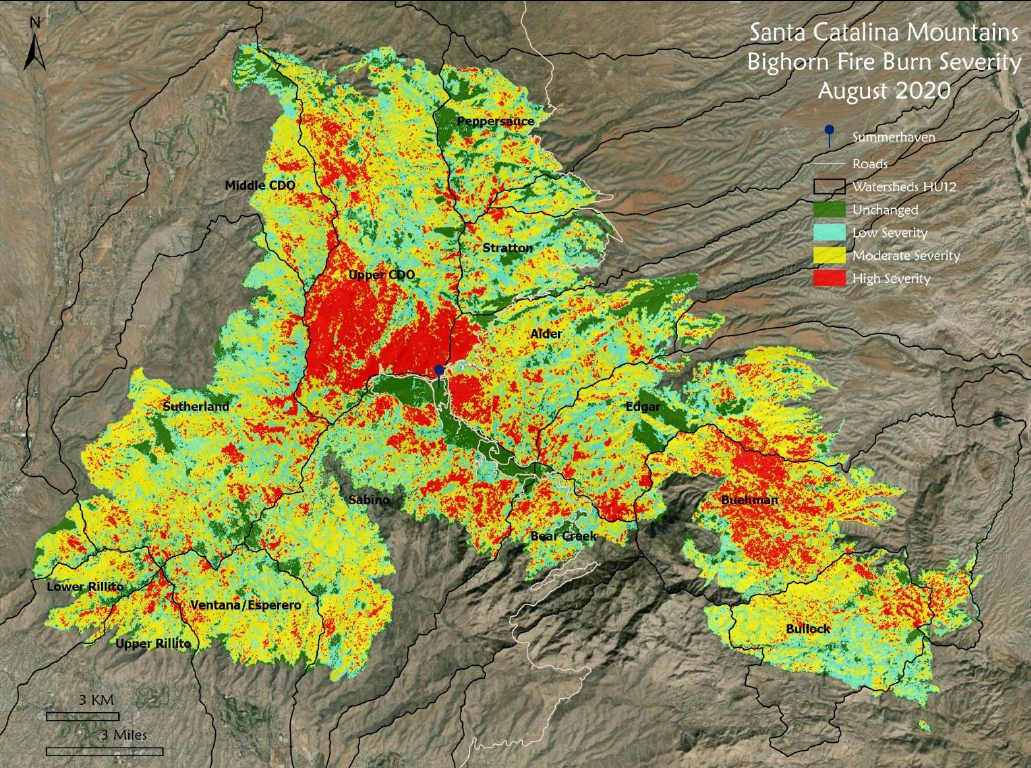
Vegetation coverage map of Santa Catalina Mountains two months after the fire. The dots identify the areas of the satellite image that were used to train the computer algorithm.
Source: Arizona Remote Sensing Centre
Check out the dataset on GeoNadir
You can check out one of the post-fire drone datasets that the ARSC team used on GeoNadir. Plus there’s plenty of other awesome datasets that people have uploaded to the platform from ecosystems all over the world.
All our datasets are crowd-sourced, so if you have drone mapping data locked away on a hard drive, consider uploading it to GeoNadir so others can learn from your work.
Got an example of an innovative way you’re using drone mapping? Upload your datasets to GeoNadir and flick us a message so we can tell your story on the Stories from Above blog.