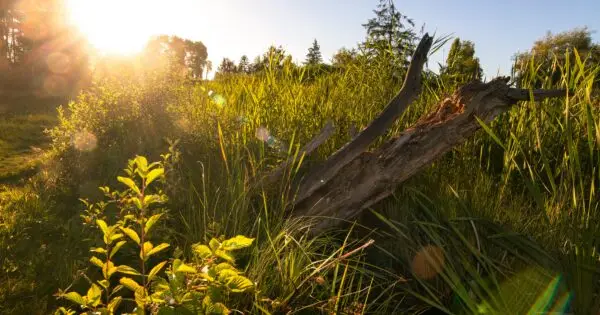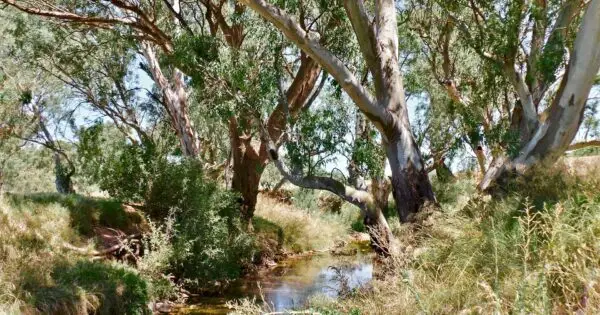
We create maps to simplify reality. To tell stories about the complex world around us in easily understandable ways. One of the ways in which we do this is to create discrete categories, and assign different features into these categories. For example, we may want to create a map of the different types of habitat on Earth – forest, grassland, desert etc. Every part of Earth will be assigned to one category within this habitat classification scheme, vastly simplifying the true complexity of our planet. It’s now easily summarised to communicate information.
When we capture drone mapping data, the images we collect are highly complex, just like the ecosystems over which we fly. There are many different ways that we can analyse these data, and no limit to the types of classification schemes we can adopt. At GeoNadir, our first step is to classify the images uploaded by the community into a simple scheme. Classifying datasets enables us to quickly search and discover datasets within a particular habitat category based on our interests (e.g. wetlands). It’s also then easy to summarise the area within each category we have collectively mapped.
In selecting the most appropriate habitat classification scheme, it was important to choose one that is globally consistent and internationally recognised. After reviewing various options, we selected the International Union for Conservation of Nature (IUCN) habitat classification scheme (version 3.1).
How does the IUCN habitat classification schemes work?
The IUCN classification scheme consists of 18 key categories, and has three levels of hierarchy. This means that we can map every part of Earth at multiple levels of detail. For example, a coral reef lagoon is classified in level 1 as ‘marine neritic’; level 2 as ‘coral reef’; and level 3 as ‘lagoon’. As such, level 1 is the most aggregated and generic level of the scheme. It is this level to which we automatically classify all drone data on GeoNadir.
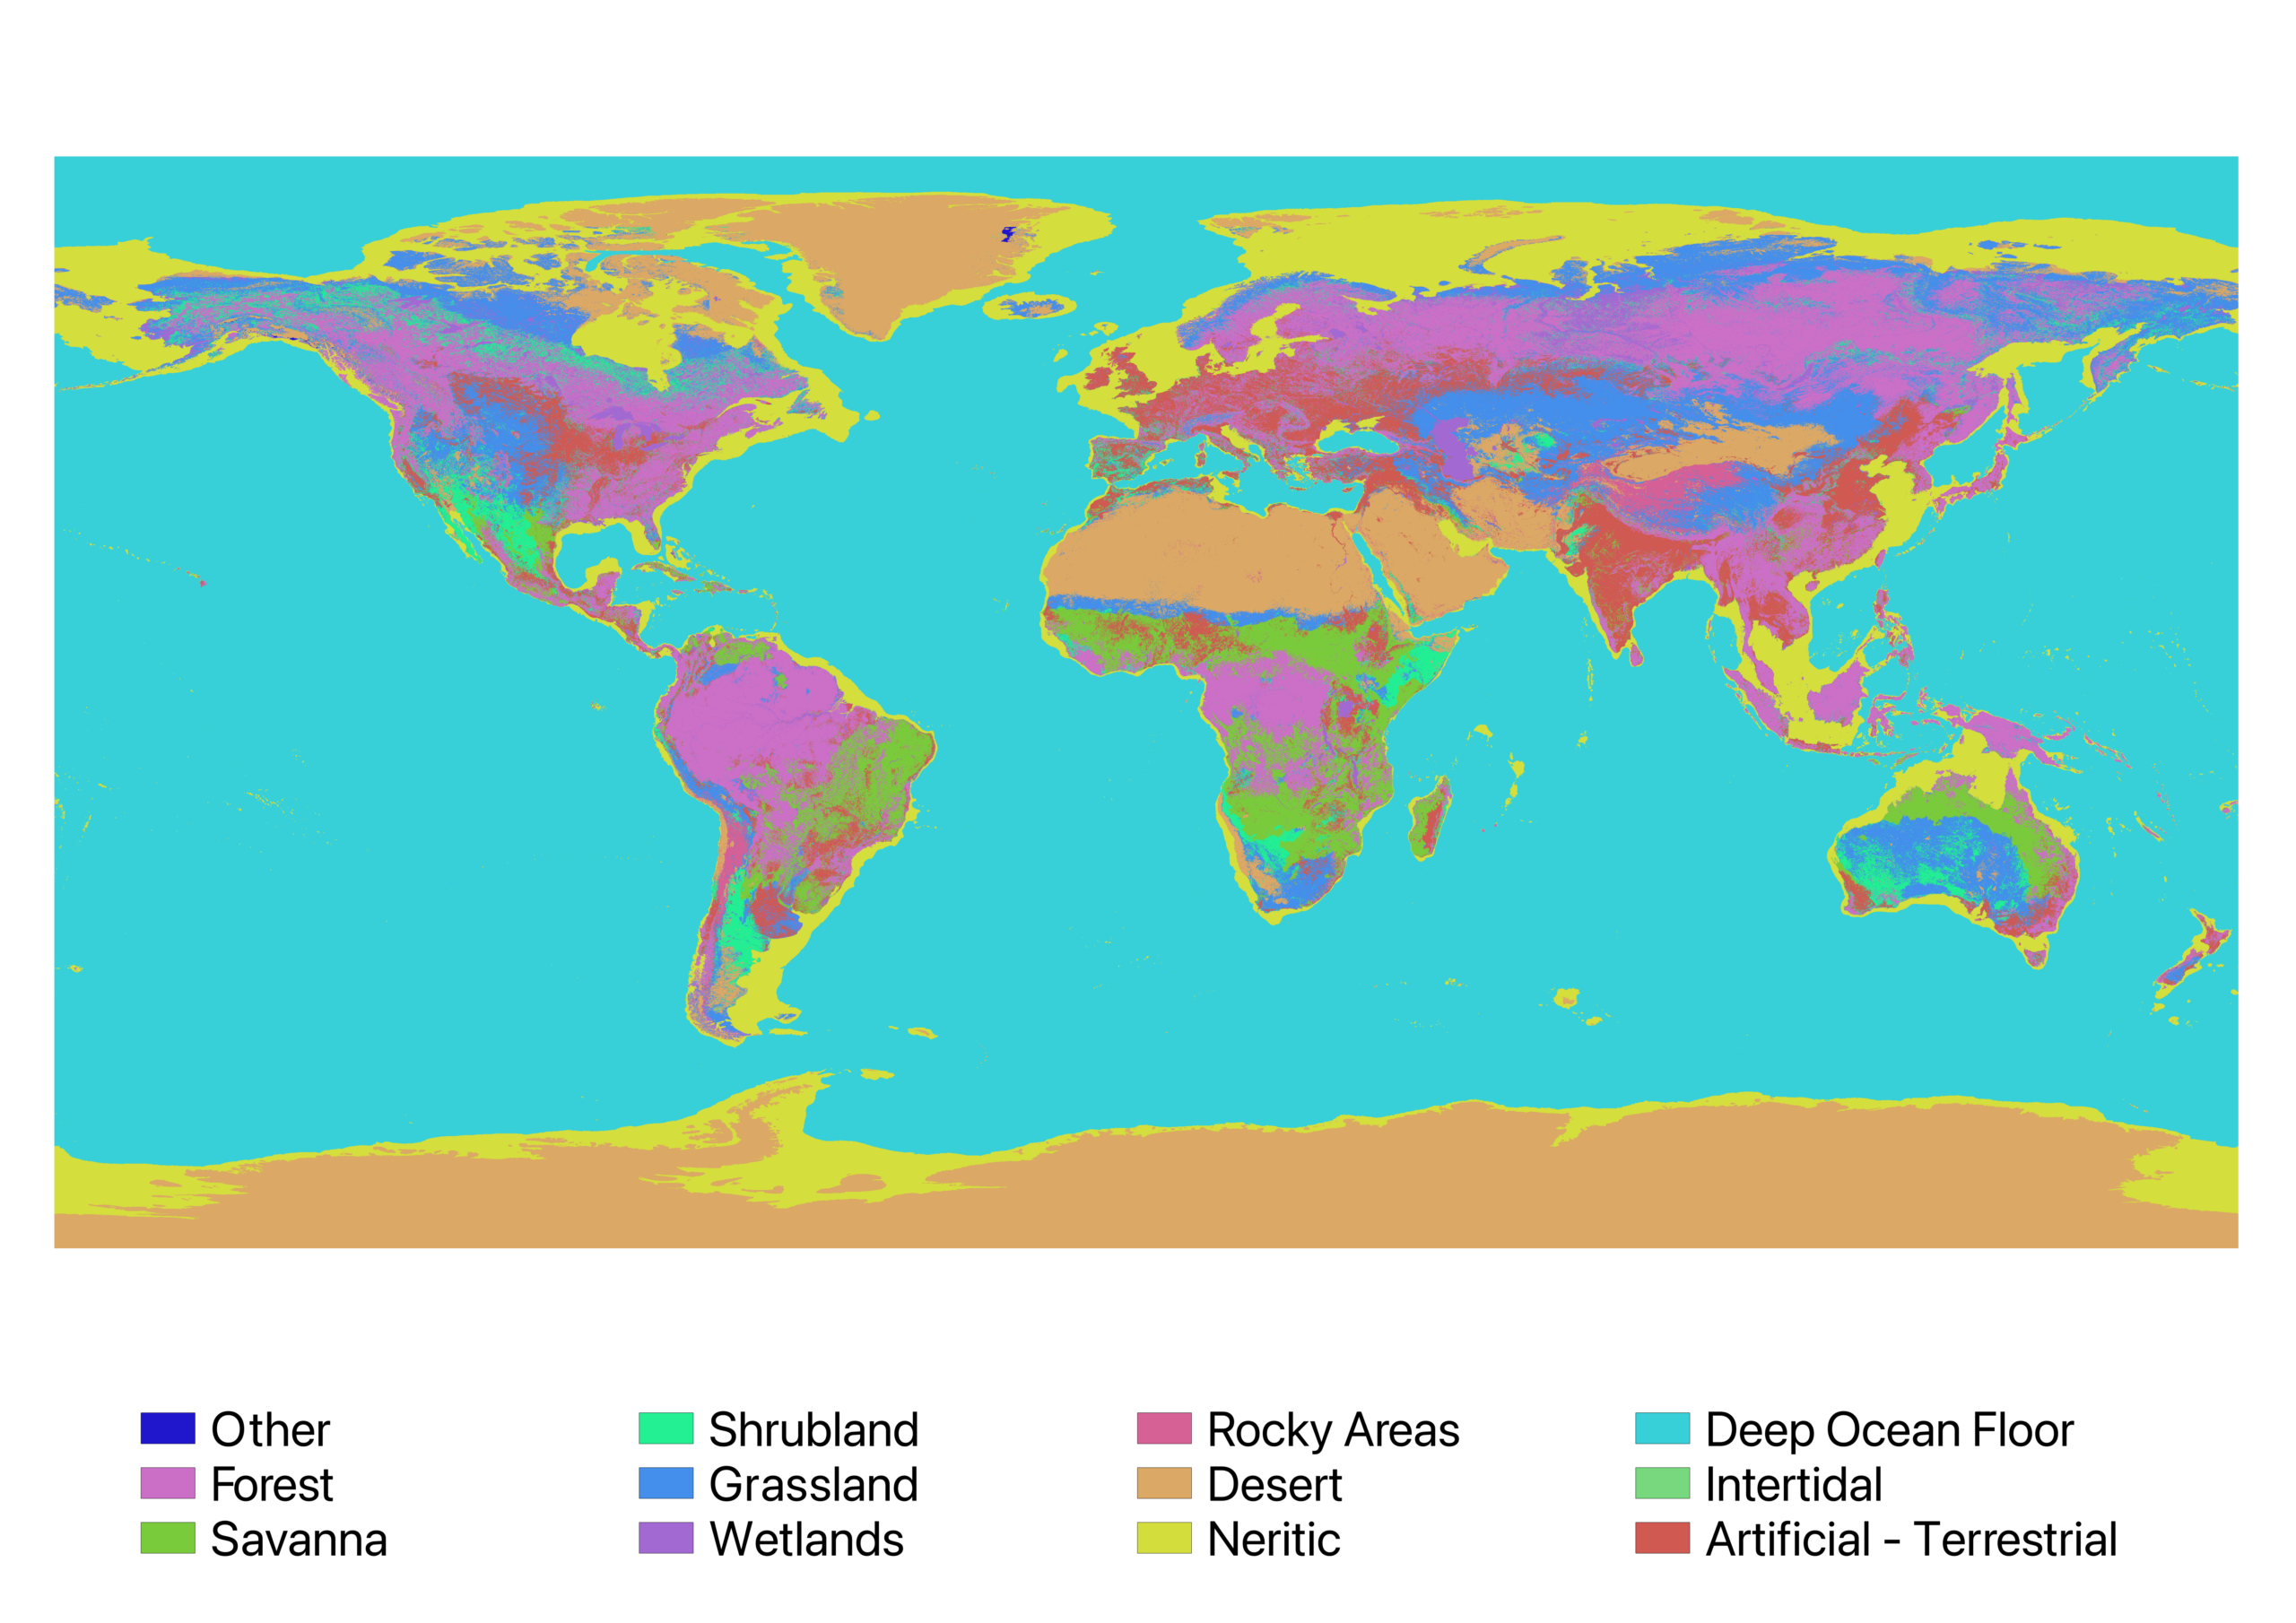
Our first step was to create a global habitat classification map. We used the method defined by Martin Jung and colleagues to build this map, with a huge number of input datasets (see the list at the bottom of the blog). When complete, we mapped Earth with a resolution of 1km pixels. This means that we assigned every 1 x 1 km patch of Earth into one of 12 mappable categories. If you think about the complexity of the world, even just within your local neighbourhood, you’ll realise that these categories are indeed simplifying reality!
How are datasets assigned to a category?
Our next step is to link GeoNadir datasets to this global map of habitats. All of the drone mapping data you capture is ‘geotagged’ with its location. So when you upload these data to GeoNadir, we take this location and compare it to our global habitat classification. We then assign the drone data to the corresponding class.
By automatically assigning a class, we keep the classification of each dataset consistent across the entire platform. And it’s one less decision for a user to make when they upload their data as well, so it’s streamlined and simple for them.
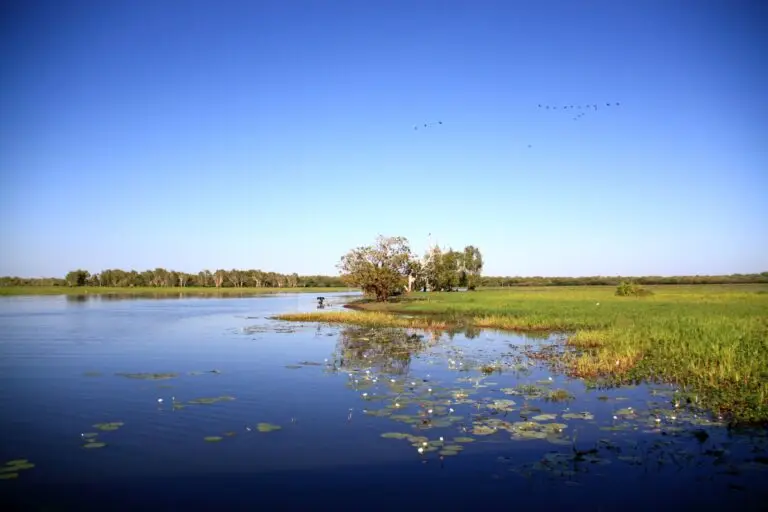
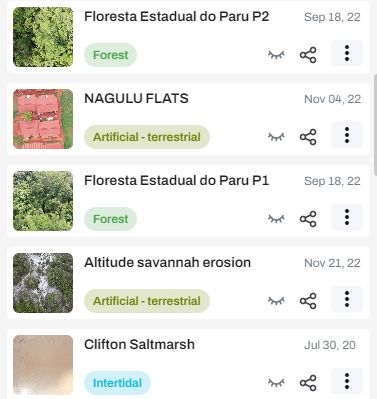
With the habitat class clearly visible on each dataset, you can also click on the class sticker to return a search of all datasets within that class. So if you’re interested in finding all the ‘intertidal’ datasets, simply click on the corresponding sticker.
How can habitat classifications help drive impact?
At GeoNadir our mission is to create the most detailed map of Earth to help protect at-risk ecosystems. We support and promote the use of community contributed drone mapping data to develop geospatial insights that help managers make data driven decisions about the land and sea country they protect. As such, it is important to us to adequately represent each of the habitat classes defined by the IUCN, which is also linked to our commitment to the United Nations Sustainable Development Goals – Life below water, and Life on land.
By themselves, the classifications don’t change the world. But they do allow us to develop baseline metrics and to report on them. This becomes critical if we are to answer questions related to how habitats change over time. Or how they respond to human intervention.
At the time of writing the GeoNadir community has mapped areas of Earth in 11 of the 13 mapped IUCN habitat classes. Note that five of the classes were not found according to the protocol used (artificial marine, caves and subterranean, introduced vegetation, other, and unknown). This is not because these types of habitats don’t exist, but because either they occur in patches too small to be mapped, or they are absent from the input datasets.

GeoNadir helps drone pilots from all over the world store, process, and share their drone mapping data. By uploading your datasets, you’re also making sure more people can learn from and use your drone data, as well as taking a step towards creating the most detailed map of the Earth. Getting started is free, so why not start uploading today!
P.S. Here’s the full list of all the datasets we used to create our global map:
- Copernucus land cover 100m Proba-V-C3 Global – discrete classification
- Copernucus land cover 100m Proba-V-C3 Global – tree coverfraction
- Köppen-Geiger climate classification maps at 1-km present
- Shuttle Radar Topography Mission (SRTM)
- CIFOR/SWAMP wetland
- Global Mangrove watch Global Lakes and Wetlands Database (GLWD)
- HydroLAKES
- Global Surface Water Global intertidal
- agricultural field size (IIASS) smallholder farms
- World Mountains (K1 Mountains)
- Alpine biomes
- RESOLVE Ecoregions dataset,
- Global planted trees extent 2015
- Global land use
- global livestock density /Gridded Livestock of the World
- History Database of the Global Environment
- Global Maps of Potential Natural Vegetation at 1 km resolution
- global seafloor geomorphic features map (seafloor, abyss, marine seabed zone and seamount base area)
- TNC seamounts, vents, seeps
- NOAA ETOPO2 golcal relief model
- WRI Tropical Coral Reefs of the World (500-m resolution grid)