Our most powerful feature this year
Drone data is incredibly powerful, but making sense of it can be overwhelming. That’s why we’re excited to introduce a new feature on GeoNadir: Classify dataset. This feature currently uses a random forest classification to help you automatically detect features in your imagery. We are investigating other algorithms to be added in the future as well.
Whether you’re mapping invasive weeds, monitoring vegetation change, or tracking coastal change, this tool can save you hours of manual analysis and help focus your fieldwork where it matters most.
But what exactly is a random forest classification? And how do you know if it’s working? Let’s break it down in plain language.
Why a dummies guide?
As GeoNadir’s non-technical founder, I’m often asked for my ‘dummies opinion’ on new features and their usability for users like me – non-technical, but informed!
As I got digging into our latest feature, I had more questions than answers! So, I decided to write this guide to help you, if you also have similar questions.
If you have more questions after reading this, please let me know and I’ll keep adding to this resource.
Table of Contents
What is Earth observation data classification?
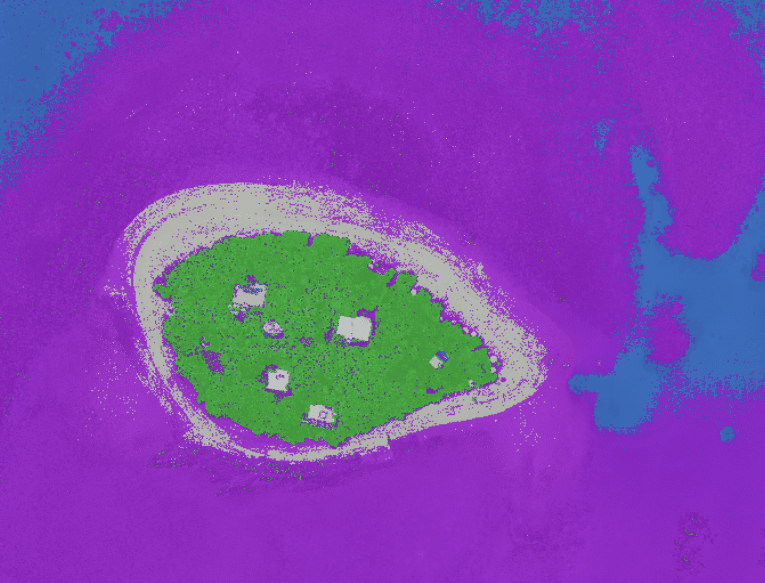
In plain terms, classification is the process of sorting things into categories to help us make sense of the world. We do it every day – like sorting laundry into lights and darks, or organising your inbox into work and personal.
In mapping and with drone imagery, we can teach a computer to recognise and label different types of land or objects in a map or image.
For example:
- Green areas might be classified as vegetation
- Grey patches as sand
- Blue sections as water
- Purple sections as reef or rock
Instead of checking every pixel manually, classification algorithms like random forest help automate the process of understanding what’s where. This is especially valuable when working with large or hard-to-reach landscapes.
So, imagine you’ve flown your drone and created a beautiful orthomosaic of a landscape. That image is made up of thousands or millions of pixels. But to a computer, they’re just numbers (colour values, heights, vegetation indices, etc.).
Classification turns those numbers (or pixels) into something with meaning.
Each pixel in your map gets assigned a label based on the features it shares with other pixels you’ve already identified.
So instead of a raw image, you get a thematic map showing clearly defined land types or features.
|
Pixel
|
What the computer sees
|
After classification
|
|---|---|---|
|
Pixel A
|
Green, low height, high NDVI
|
Vegetation
|
|
Pixel B
|
Brown, no vegetation, flat
|
Bare ground
|
|
Pixel C
|
Dark blue
|
Deep water
|
What is a pixel in a drone orthomosaic?
When you look at a drone map (or orthomosaic), what you’re actually seeing is a giant puzzle made of tiny square tiles. Each of those tiles is commonly called a pixel.
In this context, a pixel is:
- A tiny piece of the landscape, like a small square of ground
- It has a specific location (latitude and longitude)
- It stores information — like colour (red, green, blue), and sometimes other layers like elevation (DSM / DTM) or vegetation indicators (e.g. NDVI or greenness index)
Think of it like this: An orthomosaic is like a giant digital quilt. Each patch (pixel) holds a snapshot of what’s on the ground in that exact spot.
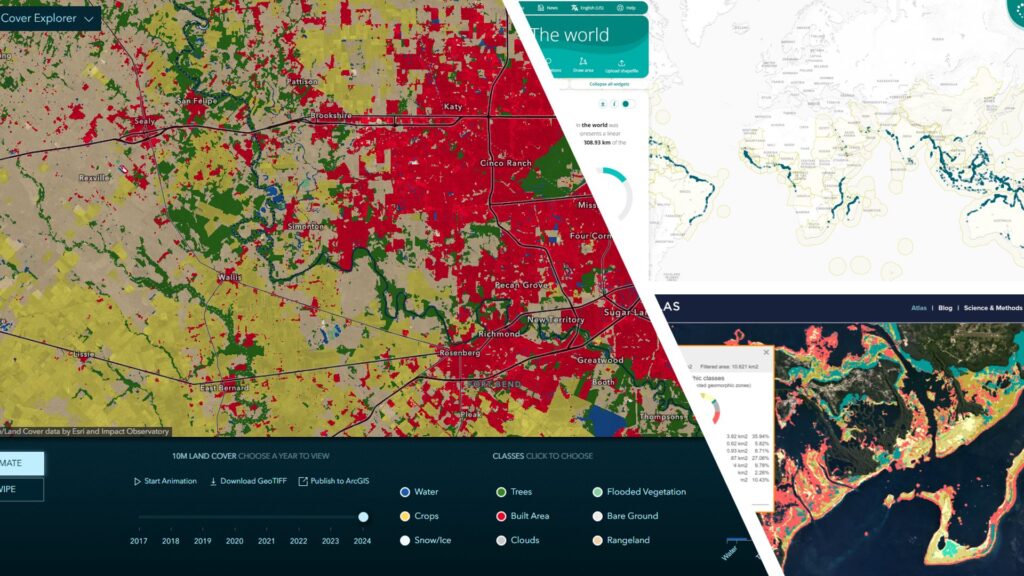
Why pixel size matters in drone and satellite imagery
When you’re working with drone or satellite imagery, pixel size determines how much detail you can actually see and work with. It’s one of the most important factors that affects the accuracy, reliability, and usefulness of your analysis, especially when you’re mapping environmental features like weeds, erosion, or vegetation change.
What is pixel size?
A pixel is the smallest building block in your image. The ground area that each pixel represents is called the ground sampling distance (GSD).
- In drone imagery, GSD might be as small as 2 cm x 2 cm (0.0004 m²) or even smaller.
- In satellite imagery, it’s typically much larger — 10 m x 10 m (100 m²) for medium-resolution satellites like Sentinel-2, or 30 m x 30 m for Landsat.
That means a single pixel from a satellite image might contain multiple trees, shrubs, and ground features, whereas a drone pixel might show the individual leaf of a plant.
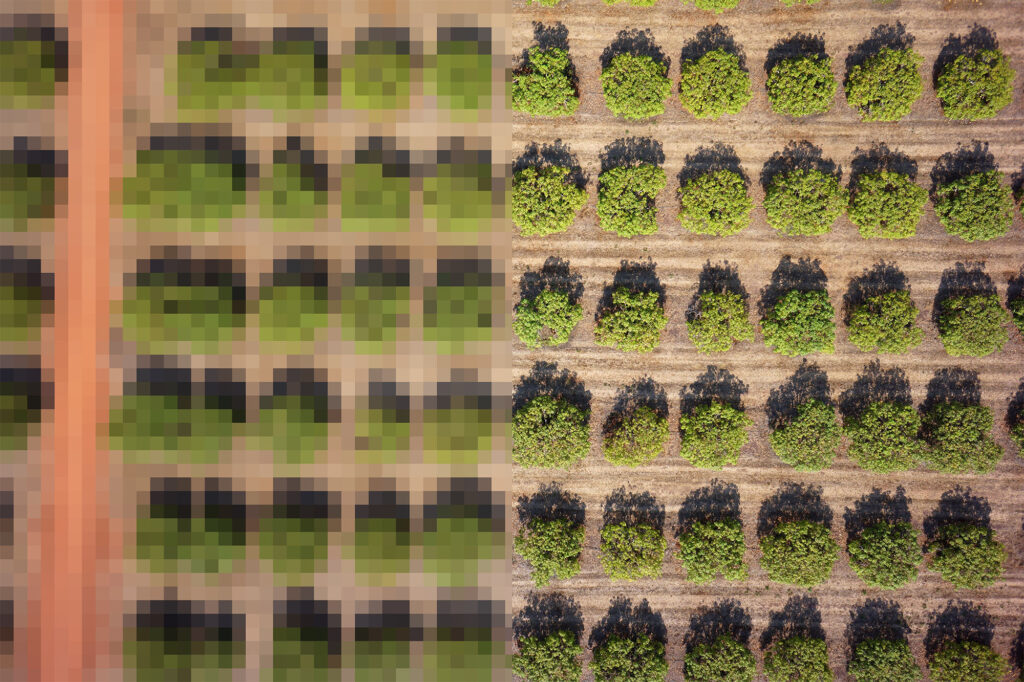
Why this is important for classification
When using tools like the random forest classification on GeoNadir:
- Smaller pixels = more precise feature detection.
- If you’re trying to find a small weed in a field, drone imagery with 2–5 cm pixels lets the model “see” the weed as a distinct object.
- If you used satellite imagery, the weed would likely be blurred together with other vegetation, making it hard or impossible to classify.
If you want to calculate how high to fly, read this blog here or use our flight parameter calculator here.
What is a random forest? (hint: It’s not that kind of forest)
When we say random forest, we’re not talking about trees that grow in the ground. Instead, we’re talking about a powerful machine-learning model that helps you quickly understand what’s happening in your drone imagery.
Let’s say you’ve flown a drone over a forest, paddock, or wetland, and you want to answer questions like:
- Where are the weed species?
- Which areas are bare soil?
- What is native vegetation vs. something introduced?
Rather than inspecting every pixel manually, you can train a computer to recognise patterns in your data – and that’s where a random forest comes in.
Meet the forest: How it works
A random forest is made up of many tiny decision-makers called decision trees. Each tree asks a series of yes/no questions about the data, such as:
- Is this area green?
- Is it tall?
- What’s the vegetation index value (e.g., NDVI or greenness index)?
- What’selevation?
Each decision tree makes a guess – its own classification – based on its ‘view’ of the data. Then, all the trees vote, and the most popular answer wins.
Think of it like a forest of mini-experts, each with a slightly different perspective. The collective decision is usually more accurate and reliable than just one expert.
What makes it “random”?
The “random” part of random forest refers to how it builds and trains the trees:
- Random data: Each tree is trained on a different random sample of the training data – in GeoNadir we use 70% of the points or polygons you provide for training and the other 30% for validation.
- Random features: At each decision point (or node), the tree considers a random subset of input features (e.g. layers like greenness index, DSM, RGB).
This randomness makes the model:
- More robust (less likely to overfit)
- More accurate (because many diverse opinions reduce bias)
- Better at generalising to new data you haven’t labelled yet.
What’s a decision tree?
A decision tree is like a flowchart. It starts at the top and works its way down:
- Each node asks a question (e.g., Is greenness index >0.3?)
- Each branch represents the outcome (yes/no)
- Each leaf node at the end gives a classification based on the layers (points or polygons) you have provided (e.g., weed, grass, bare soil)
One tree gives you one classification. A random forest gives you hundreds, and then chooses the most common answer.
Why it’s great for drone imagery on GeoNadir
Because GeoNadir users work with high-resolution, multi-layered spatial data, random forest is a great fit.
- It works well with tabular and layered data (like greenness index + DSM + RGB)
- Doesn’t need as much data prep as deep learning models
- Can be trained with just a few labelled areas (not thousands)
- Provides fast, interpretable results
Whether you’re mapping weeds in a national park, bare ground on a mine site, or vegetation changes over time, random forest gives you a reliable, data-driven way to classify your imagery, without being a data scientist.
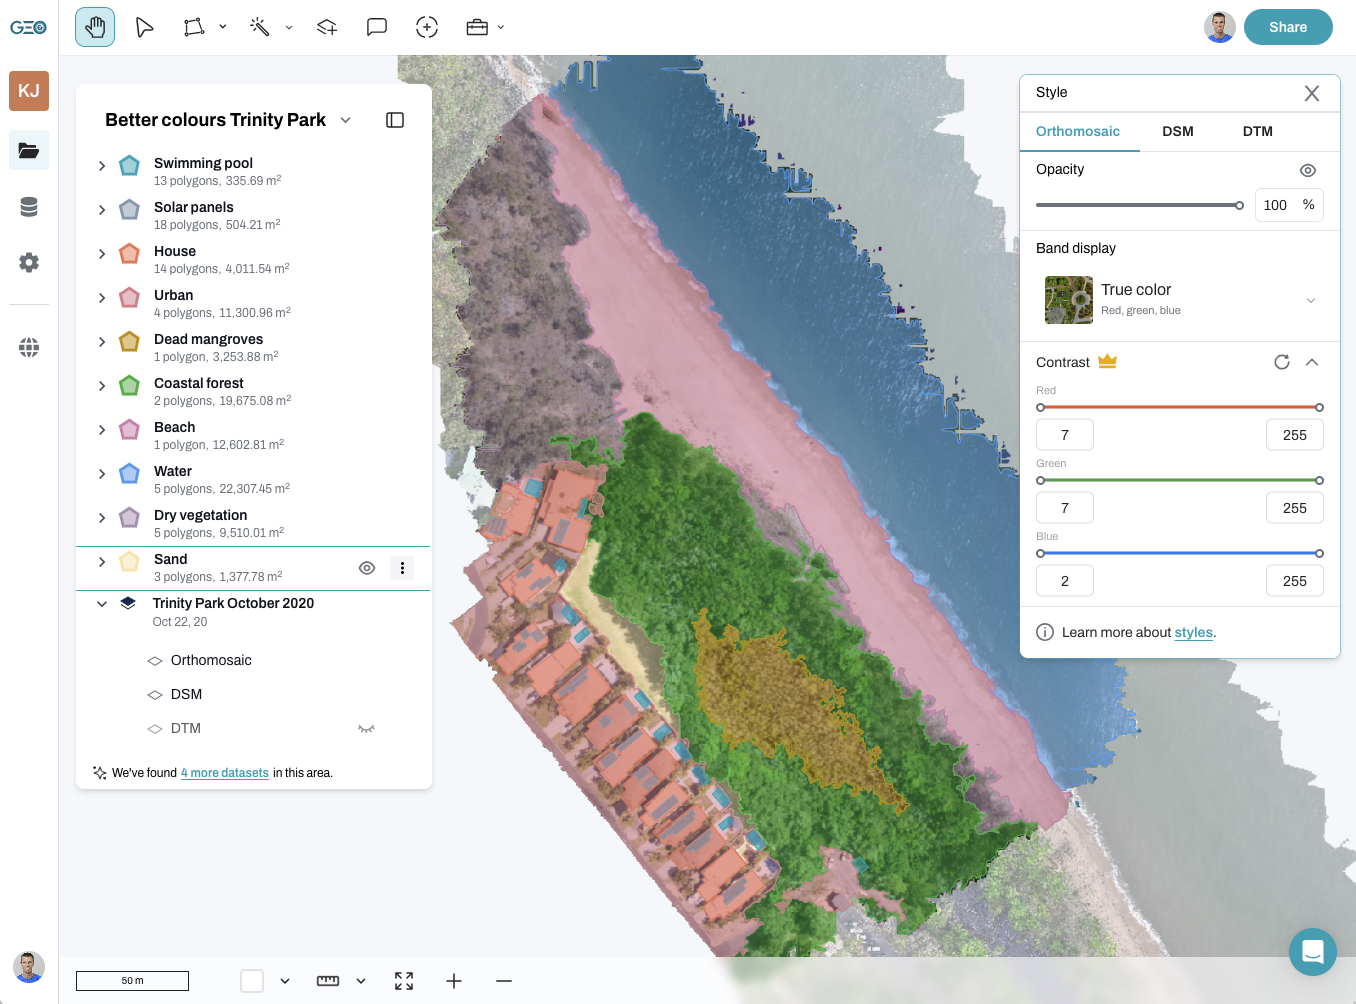
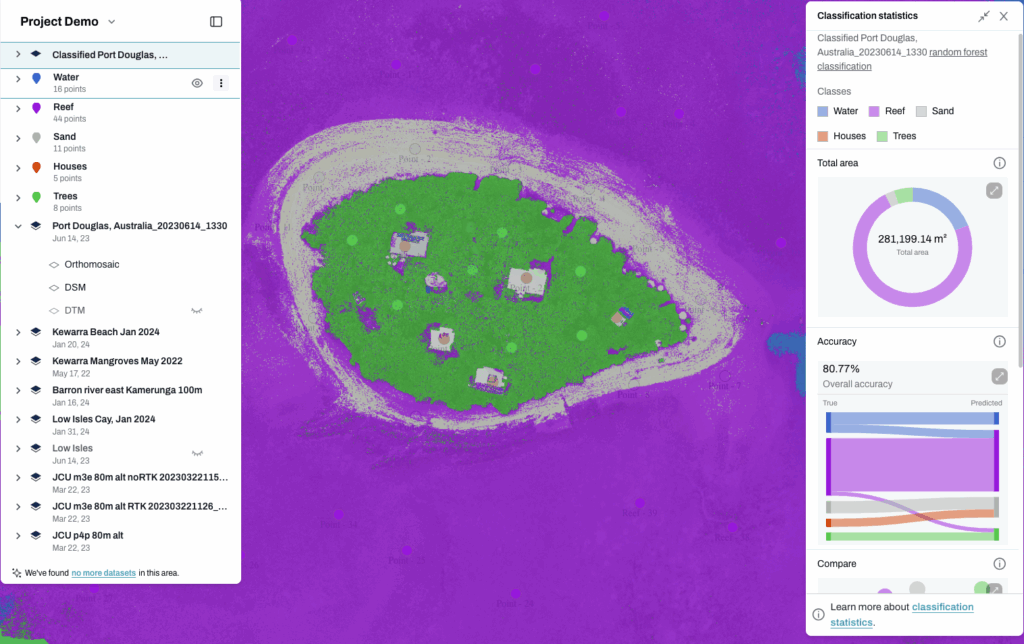
How does this work on GeoNadir?
This help article here gives you a step-by-step guide to classifying your data. But briefly, it is pretty straight forward.
To run a random forest classification on GeoNadir:
- You label a few sample areas as training data using points or polygons to create vector layers (e.g. weed, tree, water).
- You select the dataset and the vector layers you want to classify.
- You choose which raster layers to include – like RGB, greenness index, DSM, etc.
- The random forest model learns from your labels and classifies the rest of the dataset accordingly.
You’ll then get a classified layer showing what the model believes each pixel represents. You can then use the statistics tools to dive deeper into the analysis of the classification layer.
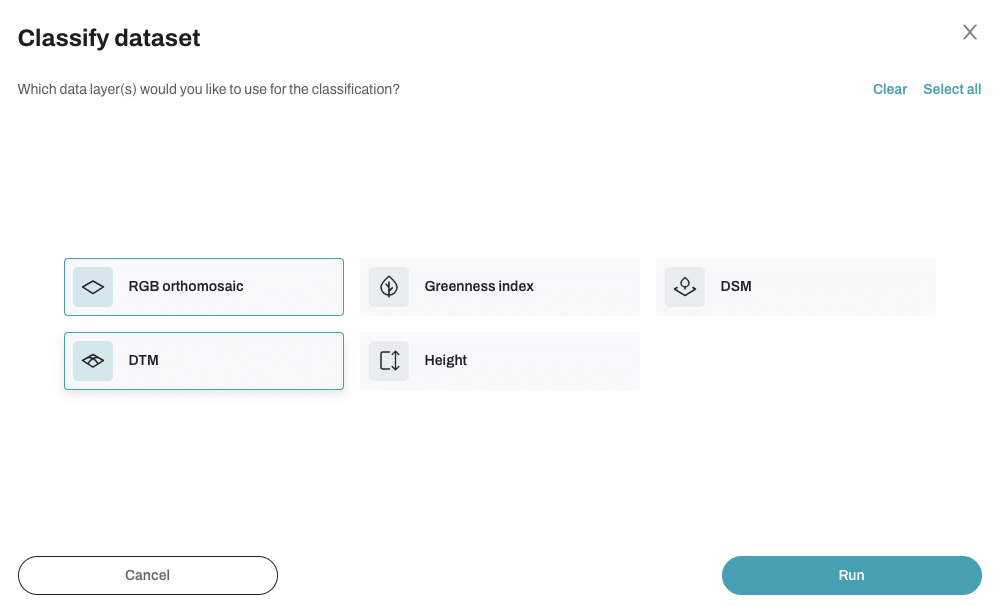
Why the layers you choose matter
One of the powerful features of GeoNadir’s tool is the ability to choose which data (or raster) layers to include in the classification.
Think of each raster layer (RGB, greenness index, DSM, etc.) as an extra clue for each tree in the forest.
- RGB gives colour info
- Greenness index shows vegetation health
- DSM and DTM provide height
The more useful layers you include, the better the model can distinguish features. But beware: adding too many layers can confuse the model if they don’t actually add helpful information.
Why too many raster layers can be a problem
- Noise and redundancy
- Some layers may contain similar or overlapping information (e.g. RGB and greenness index contain the same input information).
- This can confuse the model, making it harder to focus on the most useful features.
- Curse of dimensionality
- The more layers you add, the more dimensions the model must consider.
- In high-dimensional space, data becomes sparse, making it harder for the model to find meaningful patterns, especially with limited training data.
Imagine trying to guess someone’s job based on three clues versus 20, many of which are vague or irrelevant – it can actually get harder, not easier.
- Longer processing time
- Each additional layer increases computation time, which can slow down your workflow.
- For large datasets, this can be noticeable.
- Risk of overfitting
- If your training data isn’t diverse or large enough, more layers can make the model overfit—memorizing the training set instead of learning general patterns.
When more layers do help
This does become a bit of trial and error on your data to see what works, until you find your formula! But here are some considerations for when more layers do help the random forest algorithm:
- When each layer provides distinct, complementary information (e.g. RGB for colour, greenness for vegetation, DSM and DTM for height).
- When you have enough good-quality training data to support the added complexity.
- When you’re classifying complex environments with subtle differences.
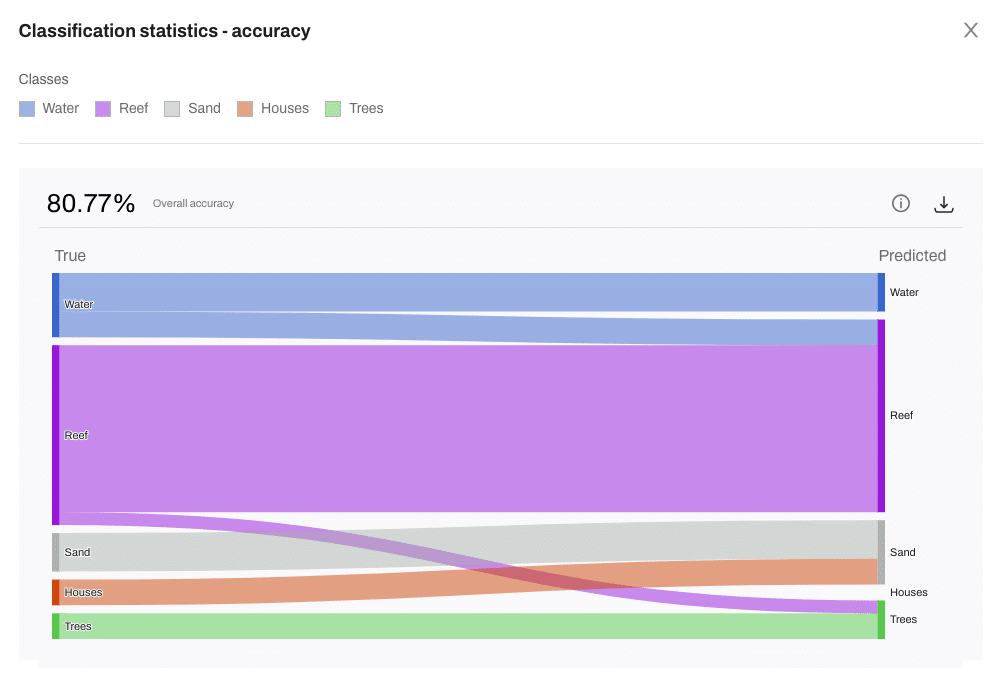
Understanding accuracy
When the classified layer is produced and you display the classification statistics, you will see a range of accuracy related statistics.
You will see a Sankey chart, which is a flow diagram that helps you understand how well the model performed. It shows how your training data was classified – correctly or incorrectly, and how things move or flow from one category to another. The width of the lines represents the amount or proportion of data in each flow.
In our case, it shows how training labels (what you told the model each area is) compares to predicted labels (what the model thought each area was).
This lets you evaluate the results and decide whether to retrain the model, add more layers, or use the map to guide field validation.
The model shows 80% accuracy. Is that good?
The short answer is, it depends. Here’s how to think about it:
- The accuracy score tells you how often the model got it right when tested against known labels.
- If you’re asking the model to detect a very tricky weed that looks almost identical to native vegetation, 40% might be impressive.
- If you’re asking it to distinguish between grass and soil in a clear paddock, you’d hope for something higher.
Accuracy depends on a number of factors. So saying that all accuracy below a certain number is bad, or above a certain number is good is hard to say. This is why model interpretation tools like the Sankey chart give richer insights than just a number.
|
Factor
|
Why it matters
|
|---|---|
|
Number of classes
|
More classes = harder task. Random guessing accuracy goes down.
|
|
Class similarity
|
Similar-looking features (e.g. dry vs. dead vegetation) confuse models.
|
|
Training data quality
|
Small or unbalanced training sets often lead to poor performance.
|
|
Class imbalance
|
If most pixels are one class, overall accuracy may be misleading.
|
What’s a good accuracy?
If you a really looking for a number though to guide you, then this table might help you get a sense for where your data sits. Remember though, it is more complex than just the single number!
|
Acurracy
|
What it suggests
|
|---|---|
|
< 50%
|
Might need more or better training data
|
|
50 - 70%
|
Decent for complex or imbalanced classes
|
|
70 - 85%
|
Solid performance, especially with clean, distinct classes
|
|
85 - 90%
|
Strong results - well-trained, well-separated classes
|
|
> 95%
|
Excellent, but double-check for overfitting
|
Can I detect a specific weed species?
We get this question a lot: Can I use random forest to find a specific weed in my imagery?
The answer: Yes, sometimes.
How will I know if random forest will work for this weed?
As we know, random forest is a supervised machine learning method, which means:
- It learns from training data you label (e.g., polygons marking weed vs. non-weed)
- It classifies each pixel based on the combination of spectral and spatial data (color, greenness index, height, etc.)
So, if your weed species has distinct characteristics in the data layers you provide (e.g. color, height), and you give the model good training samples, random forest can often detect and map it quite well.
What are some good scenarios for this tool?
Like we are learning with generative AI, it comes down to how good the content is and then the prompts you provide as a user. It can become a bit or trial and error until you find your winning formula.
Good scenarios for random forest include:
- Features with unique color or structure (for example weed species like Lantana or Prickly Acacia in open country)
- High-resolution imagery with good contrast
- Availability of DSM or vegetation indices
- Clear seasonal visibility (e.g. flowering stage)
Random forest might struggle or give low accuracy if:
- The feature looks very similar to other features in appearance or height
- It’s small, scattered, or under canopy
- Your training data is limited or hard to label cleanly
In these cases, you might need deep learning approaches, like:
- Convolutional Neural Networks (CNNs) for object detection in imagery
- Instance segmentation models (like Mask R-CNN) to detect scattered plants or clumps
- Models trained on temporal data (multiple drone flights over time) to detect growth patterns
Who should use this Classify dataset tool?
This tool is designed for:
- Ecologists mapping invasive species or vegetation communities
- Land managers identifying erosion, bare soil, or canopy cover
- Conservation teams monitoring habitat change
- Researchers and educators exploring AI in environmental analysis
If you’ve ever thought: “I wish I didn’t have to hand-digitise this entire dataset,” – this tool is for you.
If you’ve ever thought, ‘there has to be an easier way to map this’ – you’re not alone.
We are all about getting you from raw data to data insights faster, and we think this new tool will certainly help you do that!
It’s like having a digital field assistant who:
- Understands your landscape – giving you more time for decision making.
- Learns what you’re looking for- reducing time hand-digitising polygons.
- And does the heavy lifting fast – no coding or AI background needed!
What we recommend for GeoNadir users
This tool is available in Professional and Pro+ paid workspaces. Here are five final considerations for you as you get started with using this new feature.
As always, if you are not getting the results you hoped for, we are just a email or video call away to help!
1. You still need good training data
Even though random forest is powerful, it can’t magically understand your data without your help.
You still need to:
- Provide clear, accurate examples (training labels). But don’t worry, this can be quite fast to do.
- Label enough varied samples across the landscape (different lighting, terrain, density, etc.)
- Avoid bias by not just labelling one specific type (e.g. only one kind of weed in one spot)
Why it matters: If your training data are too limited or inconsistent, even a strong model like random forest will struggle – it’s learning from you.
2. Garbage in, garbage out
The quality of your input layers (e.g. orthomosaic, DSM, greenness index) has a direct impact on the quality of the classification.
Examples:
- A blurry or cloudy orthomosaic will reduce accuracy.
- A poorly aligned DSM might throw off elevation-based distinctions.
- An RGB layer with shadows or overexposure may confuse the model.
Tip: The better your drone data and derived layers, the better your results.
3. It’s an iterative process
You won’t always get perfect results the first time, and that’s okay.
Often, classification works best when you:
- Run a first attempt
- Review the results (use the Sankey chart in GeoNadir)
- Add more training labels where the model made mistakes
- Try using different raster layers
- Re-run and compare the new results
This feedback loop helps you train smarter over time, and random forest handles this kind of iteration well.
4. It’s not always the best tool for every job
Random forest is great for:
- Small-to-medium datasets
- Mixed data types (image + elevation + index layers)
- Fast results and interpretability
But it might not be the best choice if:
- You’re identifying extremely subtle or rare features (like an individual plant species across thousands of hectares)
- You have thousands of labelled examples and want to learn complex visual patterns (where deep learning might do better)
In many environmental drone projects, though, random forest hits the sweet spot of accuracy, speed, and usability – especially when you don’t have a team of data scientists.
5. Accuracy isn’t everything
People often ask: “What’s a good accuracy?” – but there’s more to it than just a number.
Also consider:
- Where the errors are – are they in areas that don’t matter as much?
- Consistency – are the same mistakes happening over and over?
- Usefulness – is the output helping guide action or insight?
Sometimes, a model with 70% accuracy is extremely useful, while a model with 90% may still miss what you care about.
Tools like GeoNadir’s Sankey chart help you see not just how accurate it is, but where it’s getting confused, so you can make better decisions.
Get personal support
Getting started with GeoNadir is simple, just like our tools to process, manage, analyse, and share your drone mapping data.
To learn more bout this tool book a personal onboarding call.
A 15-minute call will have you started and analysing your data!